
![]()
SABIC is a global leader in diversified chemicals headquartered in Riyadh, Saudi Arabia. It manufactures on a global scale in the Americas, Europe, Middle East and Asia Pacific, making distinctly different kinds of products: chemicals, commodity and high performance plastics, agri-nutrients and metals. SABIC’s Specialties business produces highly differentiated products which include specialty engineering thermoplastic resins and compounds, composites, thermosets & additives, and additive manufacturing solutions. Offering a distinct set of multi-function physical properties to serve a wide range of industries, the branded portfolio includes ULTEM™ resins, LNP™ compounds, NORYL™ resins, LEXAN™ copolymers and EXTEM™ resins.
SABIC’s Global Application Technology Centers leverage their product engineers and material processing expertise to support customers with specific requests for design, application development and testing to help bring their innovative products to market sooner. The materials data team uses cutting-edge material characterization labs, predictive engineering capabilities and part level testing to validate material data that is used for designing applications.
Executive Summary
- Recent industry trends indicate that injection-molding applications are increasingly becoming thinner with the use of highly filled resins on the rise. This demands development of newer analytical methods, material models and CAE solver capabilities for accurate process simulation
- The results from CAE simulation need to be accurate so that confident decisions may be taken on part, mold, machine, and process design
- SABIC developed a systematic approach and detailed steps replicating actual molding scenario in CAE and improved characterization of resin’s viscosity. This helped SABIC to predict injection pressures within 10% of actual value for the resins it evaluated
- This enables the design team to take confident decisions during part, mold and process development reducing reworks, accelerating development time, and optimizing development cost.
Challenges
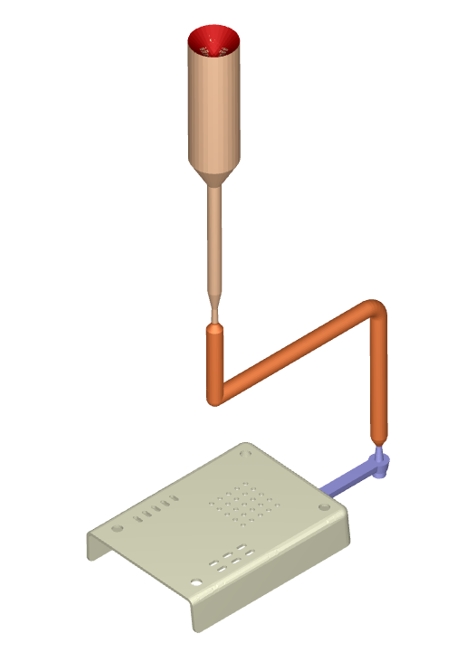
When replicating a complex multi-domain problem in CAE, we have to look holistically on the ways of representing the part, tool, material and machine as proper boundary conditions. We have to look at critical aspects like measurement of mold surface temperature, melt temperature and reduce their uncertainty while using them as inputs in CAE. We have to make sure that through a detailed in-mold rheological study the influence of injection speed on pressure to mold the part is studied leading to derivation of optimal molding window. The pressure loss that occurs in the machine screw barrel can be significant and should be captured through an air-shot study. All these studies provide insights about the process and lays a foundation for setting up the model in CAE. These will help making CAE model representative of the actual process consisting of the part, material, the flow channels, initial temperature conditions of melt and mold.
Traditionally, during polymer material characterization for viscosity, it is done by including the influence of temperature and shear rate. The influence of pressure on viscosity is not considered. The pressure significantly increases the polymer viscosity and this is very relevant for amorphous resins. In amorphous material, the Tg increases as the pressure experienced by the polymer increases. This occurs as the free volume is reduced with increase in pressure, which further increases the viscosity. In the improved method, we have accounted for the effect of pressure on viscosity, represented by D3 parameter in the Cross-WLF viscosity model that is used.
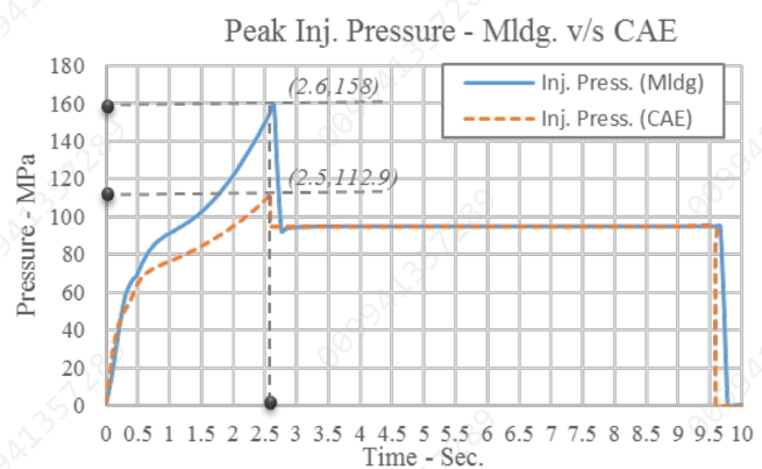
Fig A
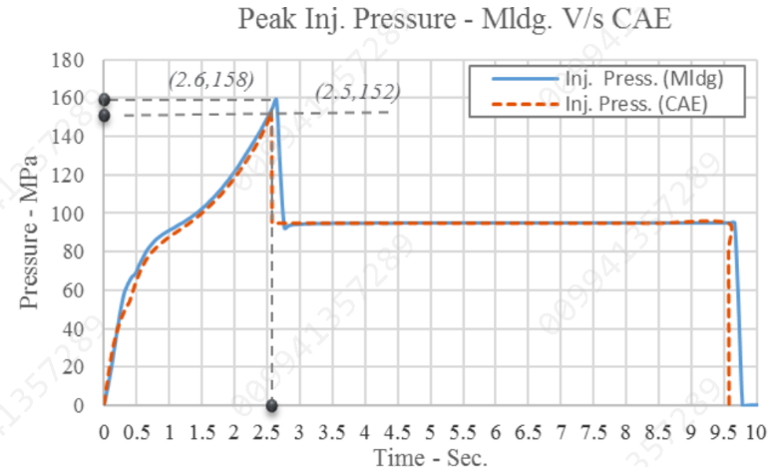
The above Fig. A shows the gap in injection pressure between experimental molding and CAE, where the material file here is not having D3 (pressure dependency).
Solutions
The SABIC team approached this in a systematic manner.
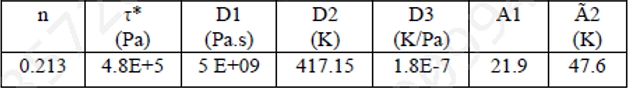
1. Material characterization – In addition to the conventional Cross-WLF parameters, the pressure dependence term, D3 in the Cross-WLF model is also critical for making an accurate estimation of the resin’s flow behavior under high injection pressures. SABIC has a methodology for measurement of D3.
2. Experimental setup – After pre-drying the material as per required settings using a desiccant dryer, and optimizing the process settings using scientific molding techniques, SABIC ran the settings for one hour (60 cycles) to allow the process to stabilize and attain an equilibrium before taking any measurements.
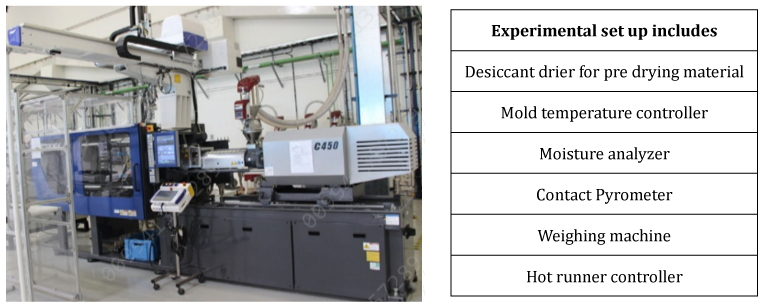
3. Data recordings – Inputs such as melt temperature and mold temperature are measured by purging and checking on cavity surface using thermal probes, respectively. All screw movement parameters such as stroke and velocity are captured with a continuous curve of pressure change w.r.t. time from the machine.
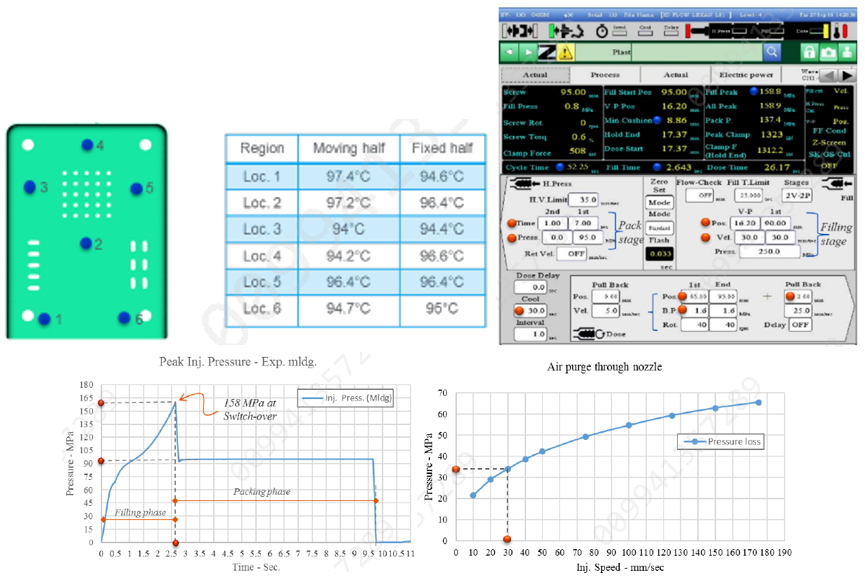
4. CAE Model – The part and the feed system, which includes the gate, cold runner and the hot drop, were all modelled using 3D elements. Considerable effort has been spent to understand the mesh sensitivity of the model on some of the key results like pressure and flow pattern before deciding it. To include the pressure loss that occurs in the machine screw barrel, the front portion of the machine nozzle geometry is included into the feed system model and finally they are integrated with the part geometry – all these are meshed using 3D elements, thus forming the basis for FE meshed model. Vents designed in mold are also measured and same are modelled in CAE model.
5. Post processing – The molding process simulation involving a typical fill and pack study was carried out in Moldex3D. The comparison of the peak pressure between experimental molding and simulation (CAE), wherein the material data used in CAE simulation is without D3 in the viscosity model – the simulation is under-predicting by about 28.9%. The peak pressure comparison, with the inclusion of D3 in the viscosity model, it has significantly improved and has a good agreement with measured pressure. The simulation is now under-predicting the measured peak pressure by 4.2%.
Benefits
This FE model has the most accurate and true representation of the physical problem.
- The resin with improved rheological characterization,
- Accurate measurements and inclusion of melt and mold temperature,
- Detailed measurement and inclusion of machine nozzle into the flow path,
- Detailed rendering of vents used into the FE model,
- Replicating the machine settings as inputs for filling and packing
All these results in a robust CAE simulation model that makes minimum assumptions about the melt properties and molding conditions, thereby providing us data to take informed decisions.
Conclusions
The approach used here while conducting molding experiments has been systematic and done with a scientific approach. It is observed and documented that the key to achieving successful correlation between experimental molding and simulation (CAE) lies with characterization of material behavior, accurate measurement and recordings of the key process parameters like injection speed, melt temperature and modeling the complete resin flow path. In the simulation domain, it is important to develop the FE model that truly represents the real world scenario as much as possible. In this manner, the results of validation show that good correlation can be established in injection molding simulation for predicting peak pressure. This in turn will enable the design team to take decision confidently during part, mold and process development.
Leading global material suppliers such as SABIC can provide advanced material data such as D3 viscosity coefficient that are essential for accurate predictions. Advanced material data and choice of right simulation technology helps save time and money, etc.