

Edited by Jessie Chen, Intern at Technical Support Team, Moldex3D
![]()
- Customer: MGS Mfg. Group Inc.
- Country: U. S. A.
- Industry: Toolmaker
- Solution: Moldex3D Professional Package, 3D Coolant CFD, Designer BLM
- View PDF Version
MGS was founded by Mark G. Sellers in 1982. As a proven single-source of manufacturing expertise and accountability – across a wide range of industries – They deliver custom, integrated solutions that drive business performance and growth. MGS’s elite engineering teams and advanced technologies are fueled by a “get it done” attitude and an entrepreneurial spirit of innovation. (Source)
Summary
The purpose of this research is to study the difference between Moldex3D with and without 3D coolant CFD feature enabled to find out the environment that can match the “virtuality” and “reality”. MGS made three different cooling fixtures and compared them with experiments and simulations. Experiments are carried out by three material designs with different cooling efficiencies, a copper pin, an isobar, and a bubbler. They used Moldex3D to compare these three cooling designs in a virtual environment with the experiment values.
Challenges
To accurately predict the potential of molding related problems in any part design is challenging. In many cases, predicting the required cooling time is paramount to the overall success of the project. Engineered cooling designs, as opposed to standard cooling designs, will increase tooling costs, but can bring high profits. Predicting cooling time accurately is critical for profitability, quality, and for justification of tool cost when engineered cooling is deemed appropriate.
Solutions
- Use BLM to build all components solid mesh to reach “real world”
- Use CFD module to fit “real world” situation
Benefits
- Bubbler design with turbulent flow has 2.9% error compared with real data
- Isobar design with turbulent flow has 4.0% error compared with real data
- Copper design with turbulent flow has 8.4% error compared with real data
- Steel design with laminar flow has 2.2% error compared with real data
Case Study
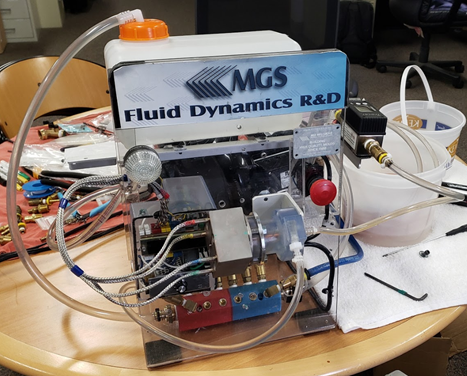
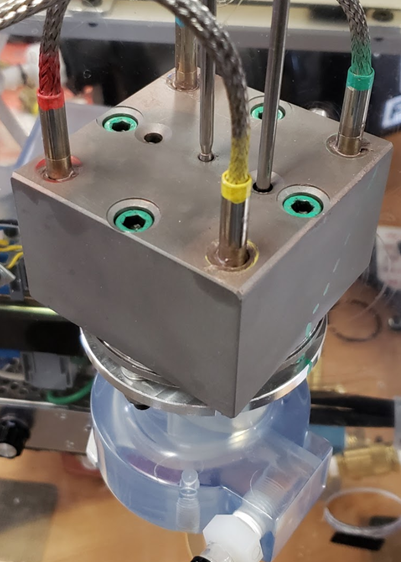
MGS made three different cooling fixture designs. Experiments were carried out on the cooling of the copper pin, isobar, and bubbler, and then the simulation results were compared with the experiment values. First, the CFD board was used in the actual experiment to measure the cooling rate, temperature, and pressure. As shown in Fig. 1, we can see the CFD board simulated cooling design configuration diagram. Fig. 2 is the fixture that houses three engineered cooling methods. The cooling fixture build was made up of 3D printed metal, tool steel, and SLA; The cooling fixture used cartridge heaters to supply heat to the fixture, and thermocouples were used to measure the temperature change of the heat block.
 |
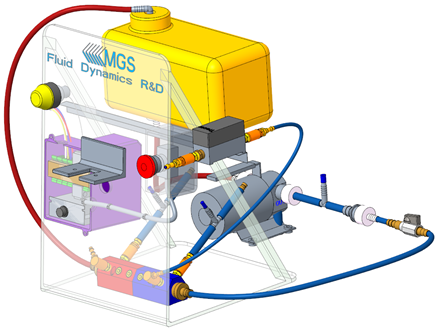 |
Fig. 1 CFD board experimental and simulation schematic diagram
 |
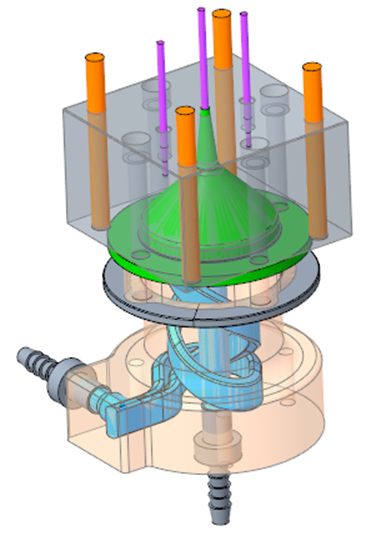 |
Fig. 2 Cooling design and simulation schematic diagram
As shown in Fig.3, we can see three different cooling designs and metal mold processing cooling water circuit test schematics, which are respectively cooled by the isobar, copper pin, and bubbler. The settings are simulated and analyzed through the experimental conditions.
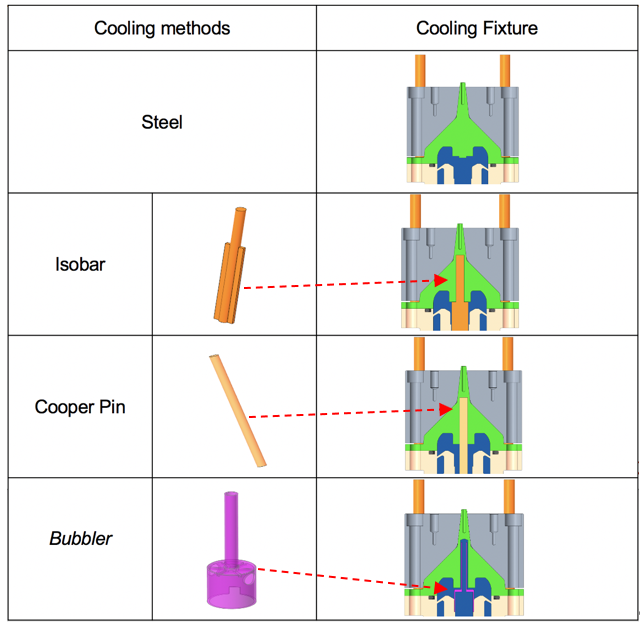
Fig. 3 Three different cooling designs and mold cooling schematic diagram
According to the experimental results, the team compared the cooling efficiency of five different cooling designs (steel laminar, steel turbulent, isobar, copper pin and bubbler) from 198ºF to 80ºF. As shown in Fig. 4, it can be seen that the orange line bubbler design cooling efficiency was better than the others. It only took 654 seconds to cool down to 80ºF; the laminar flow method using traditional cooling had the worst cooling efficiency. It took 1796 seconds to cool down to 80ºF.
The experiments and simulation tests above compare five different cooling designs, as well as the differences between the experimental values with or without the 3D coolant CFD feature enabled. From Table 1, we can see that the CFD simulation cooling analysis is enabled (green range) is more accurate than without CFD (red range), so the results of the 3D CFD calculation are in good agreement with the experiment, and the error between the simulation results and the experimental target is within about 10%.
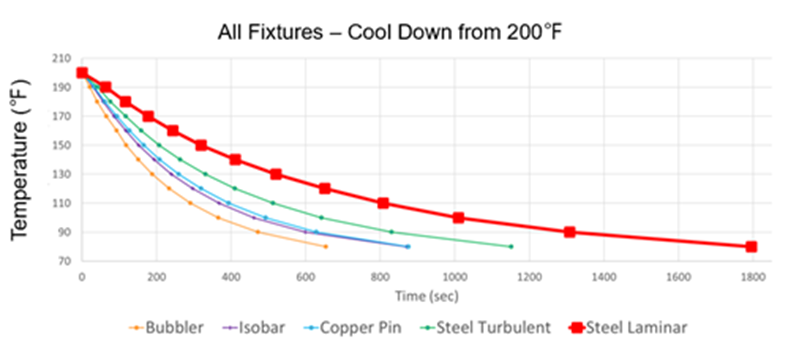
Fig.4 Results of different cooling designs
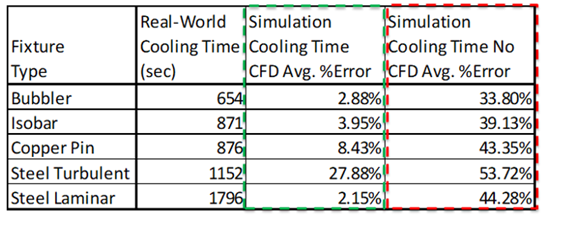
Table 1 Simulation and experiment data
Results
This project analyzed three different cooling designs and compared the simulations with experiments. The bubbler cooling design was the most effective design and could be applied in the real world. The result of this project is to compare whether 3D coolant CFD analysis is useful. In the experiment, five designs are compared and the data error of four of them is below 10%. It is clear to see that simulating a cooling analysis using the 3D coolant CFD is far more accurate than not using the 3D coolant CFD. However, if 3D coolant CFD simulation analysis is not used, the simulation and experimental errors of the five cooling designs are 30% to 55%. Therefore, the use of Moldex3D with 3D Coolant CFD analysis can help in obtaining the most accurate cooling analysis results.