
Edited by Jasmine Ho, Engineer at Technical Support Team, Moldex3D

- Customer: Alfred Kärcher SE & Co. KG
- Country: Germany
- Industry: Consumer Products
- Solution: Moldex3D Advanced Package, Flow, Pack, Cool, Warp, Designer BLM
Kärcher is the market leader worldwide for cleaning solutions, offering over 3000 products – almost all products include at least one molded part. (Source)
Summary
Millions of components are manufactured at Alfred Kärcher SE & Co. KG each year. While the warpage is critical for the functionality and appearance of the components, cost-effectiveness is determined by cycle time and the size of the required molding machine. Kärcher presents a workflow using Moldex3D that enables a fully automated optimization of all objectives. The main benefit of the workflow is the simultaneous parameterization of the component geometry, the process conditions, and the mold design. This enables us to consider the whole design and manufacturing process, beginning at development, to mold making, and finally production.
Challenges
- Optimization of geometry design, mold design and process conditions
- Component quality and production cost
- Automation of the whole simulation process
Solutions
Using Moldex3D API to automate the simulation process
Benefits
- Finding the global optimum of warpage, filling behavior, cycle time
- Fully automated simulations
- Less development time
Case Study
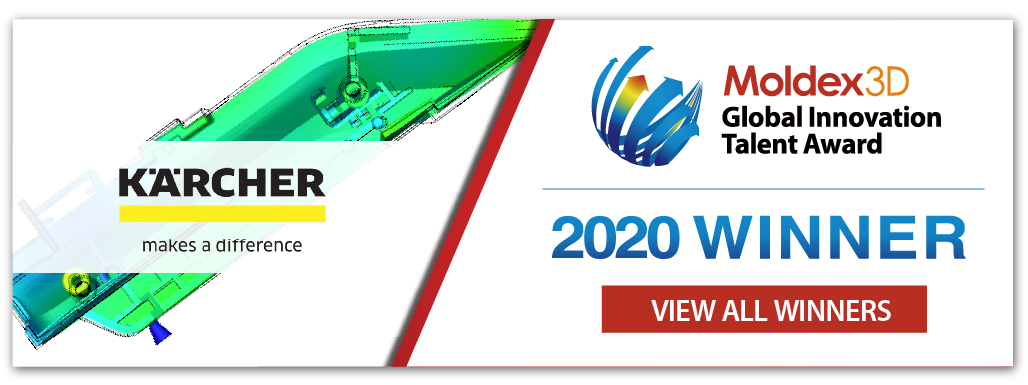
In this study, the target had to solve the warpage issue and reduce the cycle time of the battery slot. There are three main component quality requirements – 1.straight assembly surface, 2.straight battery slide and 3.screw dome position as shown in Fig. 1. To find the optimized solutions, the team conducted some variation setups and used Moldex3D to verify the design changes. The variation setups included the 3 steps below:
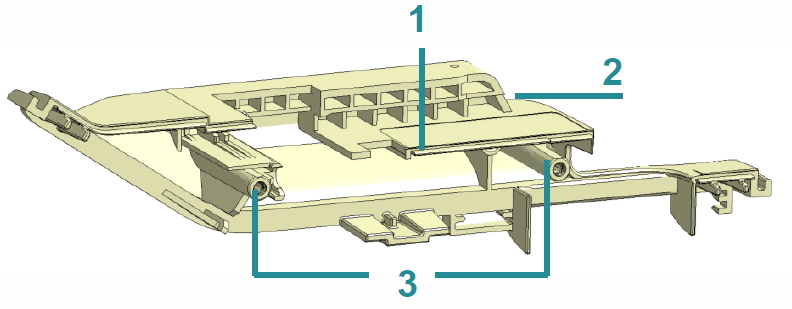
Fig. 1 The original design and three main quality requirements.
Step 1: Variation of the component design
There were totally 38 geometry related nondependent parameters, including the variation of the existing and additional ribs (Fig. 2).
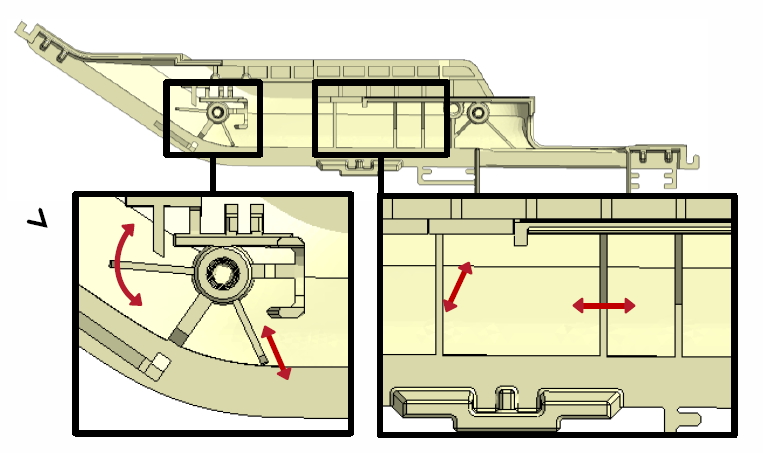
Fig. 2 Parameters for geometry optimization
Step 2: Variation of the mold design
In this study, only the gate locations were varied (Fig. 3 a).
Step 3: Variation of the process conditions
There were 14 manufacturing process related parameters, including filling time, packing time, packing pressure, melt temperature, switch over time, temperature of the coolant (Fig. 3 b) and cooling time.
Fig. 3 (a) Variation of gate locations; (b) Variation of coolant temperature
After the variation setups, they proceeded the verifications through Moldex3D API (Fig. 4). Over 200 simulations were performed in the following application and calculation time was less than one week on a single computer using 12 cores. Parallel execution of multiple simulations could further decrease the simulation time.
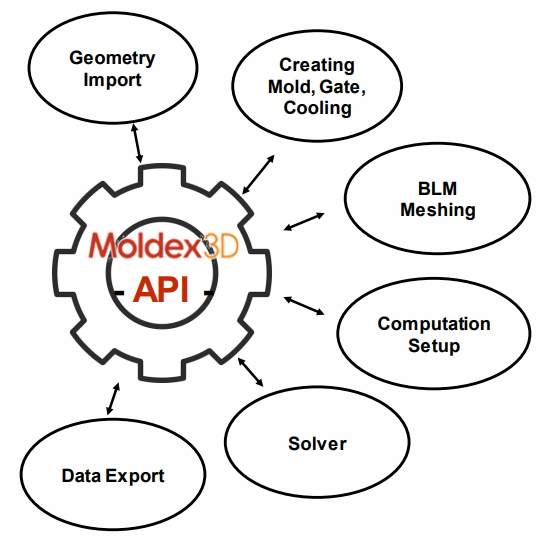
Fig. 4 Moldex3D API sketch chart
To get flexible and individual response values for the optimizations, they added probe nodes in the compelling areas. The warpage was probed at 32 locations and optimization was done by root mean square of five groups (Fig. 5).
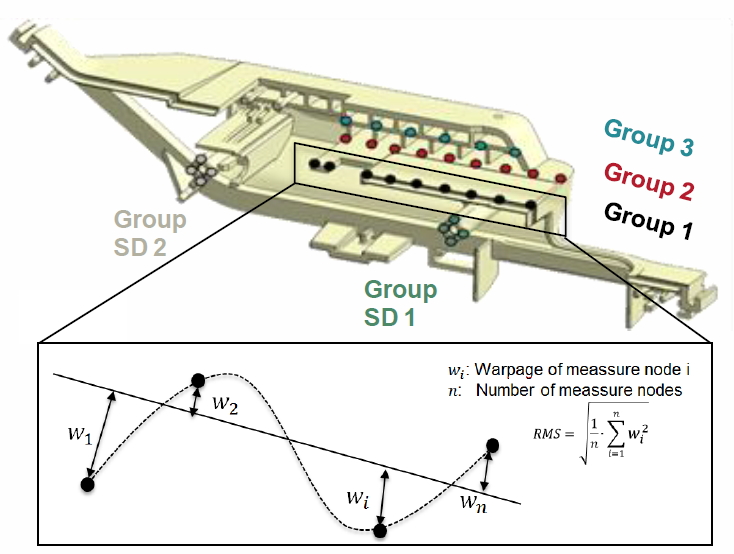
Fig. 5 The optimization areas for warpage reduction
Two optimized designs were chosen to observe the warpage and cycle time results. If optimization was focused on warpage, the warpage was strongly reduced while maintaining cycle time at an economically viable level (Fig. 6). In addition, if the optimization is focused on cycle time, the cycle time was shortened while the warpage was reduced significantly (Fig. 7). Moreover, Moldex3D simulation results shows a strong correlation with the real part (Fig. 8).
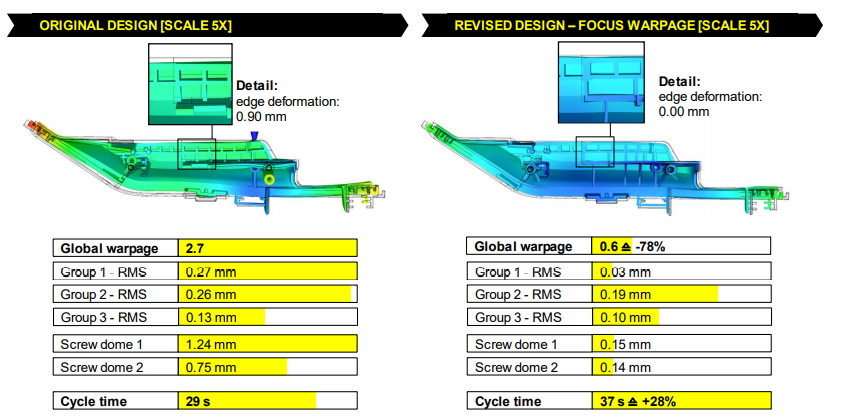
Fig. 6 Comparison between original design and revised design (Optimization focus on warpage)
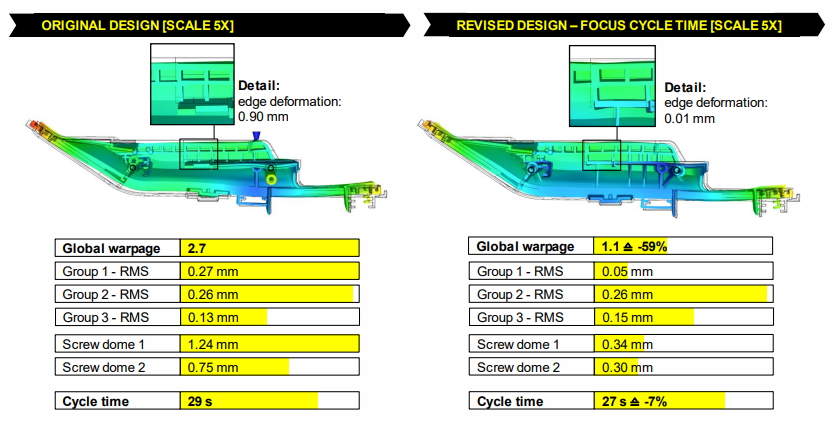
Fig. 7 Comparison between original design and revised design (Optimization focused on cycle time)
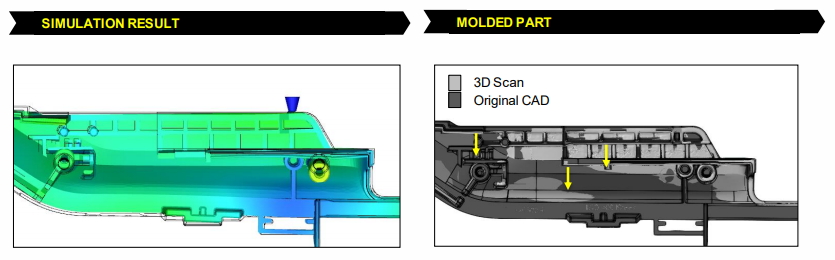
Fig. 8 Validation on the simulation results
In conclusion, Moldex3D brought a great level of automatization and customization to simulation workflow. The component geometry, mold design as well as the molding process could be varied in one workflow, and reliable simulation results could be obtained with small error discrepancy.
Results
In this study, Moldex3D API helped the Alfred Kärcher team reduce warpage by more than 70% as well as the cycle time. With the automated simulation process provided by Moldex3D API, no user input was required to run a complete simulation. Furthermore, other functionality could be integrated as well. Using a CAD system to automatically create and vary the component geometry. Apart from the component geometry, the software allows users to vary many parameters related to the mold design and the molding process. It also helps users to find the global optimum of warpage, filling behavior, cycle time and other target metrics, while reducing development time significantly.