
 |
Jye Wang, Manager at Moldex3D Material Research Center |
Preface
There are many types of plastics. Due to the variety of product functions and process requirements, the characteristics of each type of plastic are unique and different. Plastics undergo complicated processes such as heating and melting, deformation, compression, and solidification during the molding process. The accuracy of the material model and its parameters directly affects the accuracy of the molding simulation. Therefore, understanding the variability of plastic characteristics during the molding process is the key to a successful molding simulation. It is also an important tool for improving molding technology and product quality.
The complex behaviors of polymer materials are one of the bottlenecks of molding technology. The main physical properties that affect the processing properties of polymer materials include rheological properties, PVT state properties, thermal properties, mechanical properties as well as reaction kinetics for thermosetting polymers. With the development of the plastic industry and the applications of polymer theories, most of the important physical properties can be obtained by commercialized instruments. For example, the rheological properties of the melt in different ranges can be measured using capillary rheometers and rotational rheometers. Other commercial instruments such as PVT measuring instruments, DSC, TMA, DMA, universal testing machines, etc. have also been widely used. However, with the ever-increasing requirements for product quality and accuracy of molding simulation, the measurement range of the instrument and the accuracy of the data are bound to increase. For example, as the product thickness decreases, the maximum shear rate at the filling stage will increase, leading to severe non-uniform temperatures. Thus, the requirements for the high shear rate measurement limit and temperature dependence of the material viscosity also increase.
With the rapid progress of computer hardware technology and the development of numerical simulation methods, CAE analysis has become one of the necessary steps for product design and solutions to various process problems. In addition, CAE technology can also be applied in the instrument design and even the improvement of material measurement. We can call it the “material digital twin”. The internal structure of the instrument, measurement process, and material behavior can be visualized through a powerful CAE tool. It can be used as a tool for the refinement of material measurement as well as instrument design and material development.
Digital Twin of Instruments
A digital model can be built based on the significant characteristic structure of the instrument (called the “instrument digital twin”) as shown in Fig. 1. Through numerical analysis, it is possible to visualize the internal properties of the instrument during the testing to assist in the design of instruments, such as the optimization of the heater, the power determination, the best location for the measurement sensors, or the design of the cooling channel, etc. (Fig. 2). In addition, the changes of each component during the measurement process, such as thermal expansion and shrinkage, deformation of the chamber, and compensation can be determined by the instrument digital twin. Through this analysis, one can optimize the design of the instrument, implementation of the testing, and verification of various design schemes during the design phase. Thus, the problems in the future development and operation can be predicted and prevented, and the measurement accuracy and efficiency can be further ensured.
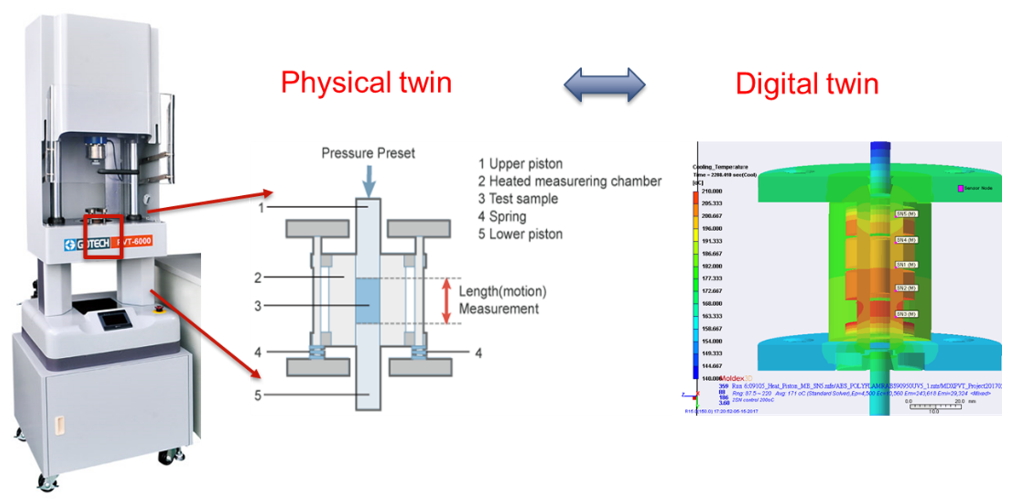
Fig. 1 The physical and digital twin of a PVT instrument
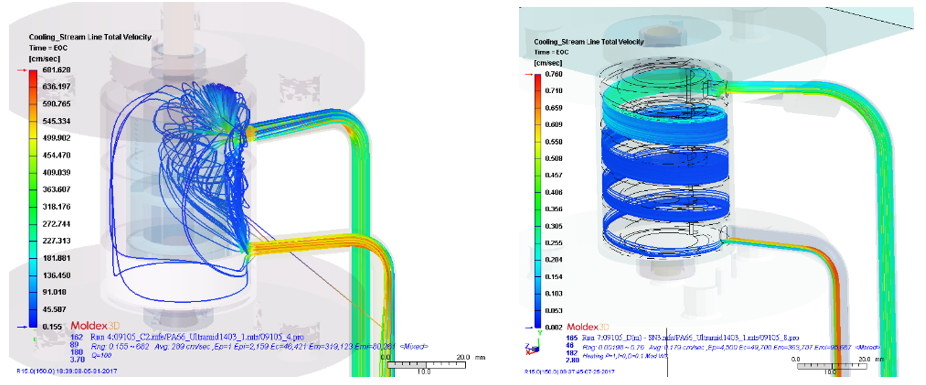
Fig. 2 The cooling channel designs of a PVT instrument
Digital Twin of the Material Measurement
The digital twin can be directly applied in the measurement process apart from the instrument design as well as compensation and calibration at the development stage. One of the most important properties in the injection molding filling process is the shear viscosity, and the capillary rheometer is currently the most widely used instrument for measuring the shear viscosity of polymer fluids. Taking it as an example, we use Moldex3D to establish the corresponding digital model according to the feature structure of the instrument as shown in Fig. 3. By applying the appropriate material models such as rheology, thermal properties, and PVT of the melt, the physical state of each position inside the instrument (such as temperature, pressure, shear rate, and shear stress) can be visualized through Moldex3D Solver’s analysis and be used to correct the non-ideal situation.
For example, the temperature has usually been assumed uniform during the testing. However, except non-uniform temperature distribution caused by the imperfect heating control system, the viscous heating would cause the rise of temperature near the tube wall during the flow. It results in the temperature distribution not only in the radial direction but also in the axial direction. For example, the surface layer may rise more than 20°C under the shear rate of 5000 s-1 as shown in Fig. 4. We know that the viscosity of polymer melt is very sensitive to temperature. Generally speaking, for amorphous polymers in the processing temperature range, the viscosity change under the temperature of 20℃ is about 40%-150% depending on the shear rate. Thus, the shear rate of injection molding may often exceed 10,000 s-1. In other words, the error of the measurement data caused by the deviation of the temperature is not negligible. Although the viscosity at ultra-high shear rate can be measured by capillary rheometer or the online rheometer on the injection molding machine, the reliability of data is reduced severely with the increase of the shear rate due to the influence of the viscous heating.
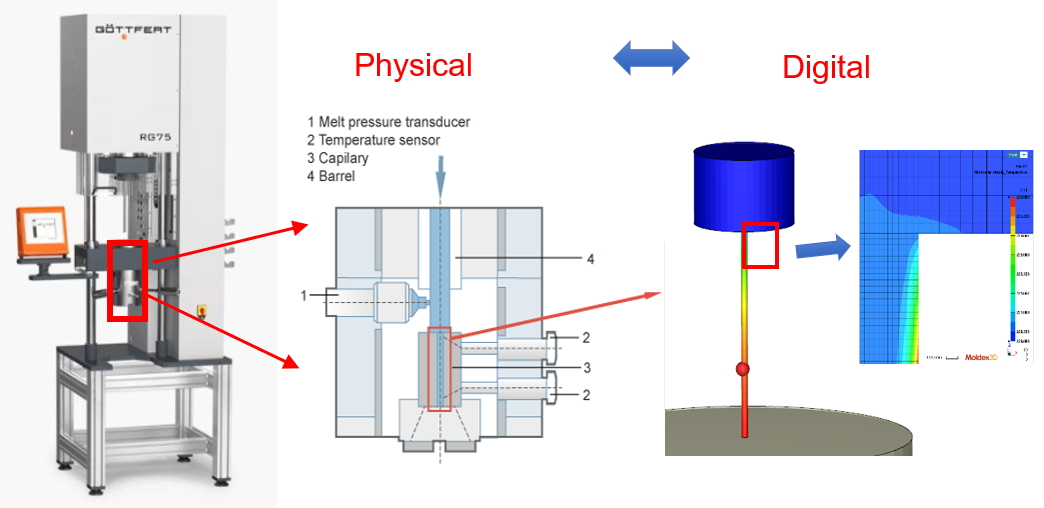
Fig. 3 The physical and digital twin of a capillary rheometer
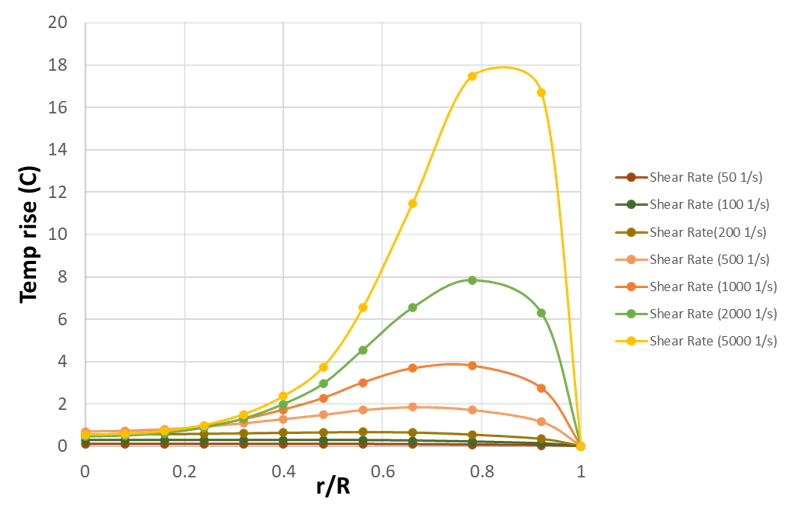
Fig. 4 The simulated temperature distribution in the capillary tube
It is difficult to measure the temperature distribution of fluid directly by installing sensors because the diameter of the capillary is too small (about 0.5~2 mm). Furthermore, it would not be accurate to measure the viscous heating effects by single or a few temperature measurements. The reason is not only the temperature but also the shear rate is not uniform for both radial and axial direction. However, through the digital twin of the material measurement, one can obtain the distribution of the physical quantities of arbitrary locations in the system. The variation and deviation of the properties can be used to correct data to improve the measurement precision. The flow chart of the material digital twin is shown in Fig. 5. The data and parameters of the model are corrected by the proposed iterative algorithm until self-consistent indicating the digital twin can completely represent the physical twin of the instrument. Therefore, the material parameters after the correction can be more accurate and reliable.
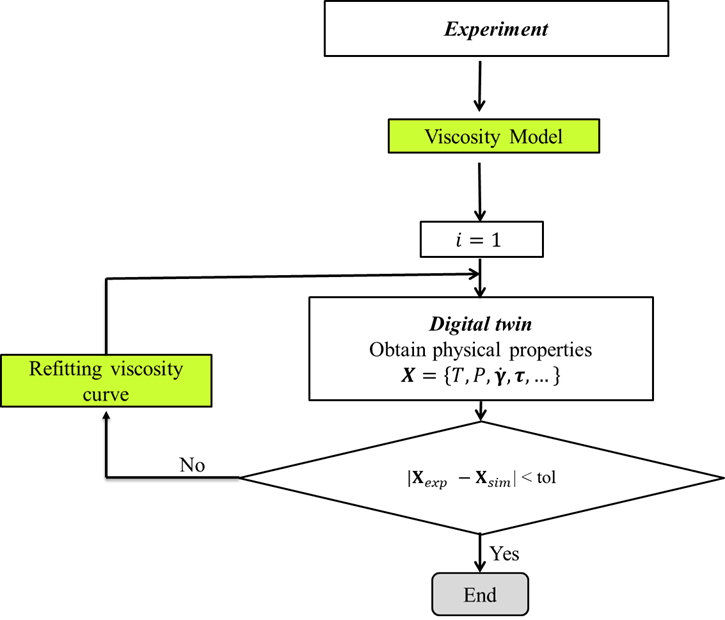
Fig. 5 The flow chart of the material digital twin correction
Fig. 6 shows the predicted and the experimental pressure with and without the correction of the material digital twin for two commercial plastics. The solid line is the multi-stage pressure data testing output from the rheometer. Seven-step speeds are set from low to high, hence the pressure responses are from low to high. If the measured viscosity curve is directly put into the simulation, the prediction of a low shear rate agrees with the experiment well. However, when the shear rate is high, especially for the 5th to 7th sections, the pressure is obviously underestimated due to the viscous heating. After the correction of the material digital twin, the predictions and experiments are consistently better.
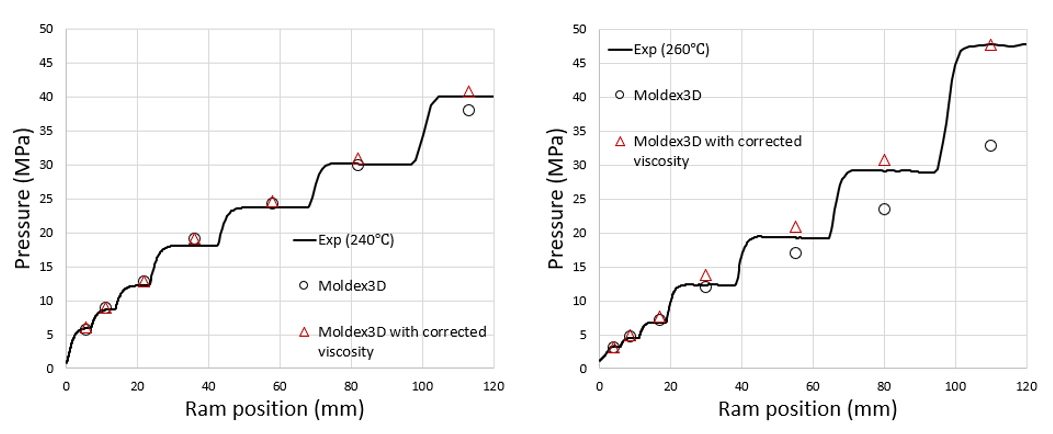
Fig. 6 Measured and predicted pressure of the capillary rheometer: (a) HDPE; (b) PBT+30%GF
Conclusions
The proposed material digital twin can be used to evaluating the variation of material properties (the viscosity, PVT, specific heat, thermal conductivity, etc.), and the changes of the states (pressure, flow stress, thermal stress, temperature distribution) during the material measurement process. Furthermore, the complete digital twin model with the structural feature of the instrument and the testing process can be used not only to correct and improve the measurement data but also to be a powerful tool for material development and measurement as well as the development of new instruments and equipment.