

Philip Chang, Senior Engineer, Technical Support Division

- Customer: Shanghai Jiao Tong University
- Industry: Automobile
- Solution: Moldex3D Professional Package, Flow, Pack, Designer BLM
Shanghai Jiao Tong University established in 1896 in Shanghai is one of the oldest and most famous universities of China. SJTU is designated a leading institute in China’s “Project 985” , ”Project 211” ,”Double First Class University Plan”.
Summary
The uneven colored white spot often appears nearby the gate in injection molding of automotive parts, which affects the appearance of the product. The occurrence of the white spot is related to the injection parameters and mold structure. This research adopted Moldex3D to simulate the injection molding process and integrated practical experiment to show the relationship between the Von Mises Stress and the white spot on the product surface. The purpose of this study is to optimize injection parameters and mold structure via simulation help minimize the risk of white spot occurring.
Challenges
The uneven color often occurs in the downstream area of groove near the gate, and the reason for this issue is complex and difficult to solve. Troubleshoot the reason the white spot occurs and the improvement method among complicated factors of injection molding via simulations. Create the relationship between glossiness and molding parameters, as well as optimize the molding parameters.
Solutions
Moldex3D is used to simulate the injection molding process of the ASA study model. Different injection parameters and mold structure such as melt temperature, injection speed, mold temperature, and gate thickness are simulated to study the cause and improvement of the occurrence of white spot. This study should verify the correctness of the obtained relationship through practical experiments to propose the recommendation for improving the occurrence of white spot on the surface of ASA study model.
Benefits
Among the various injection parameters, find out the main impact factor for the occurrence of white spot on the surface of ASA study model. Point out the correct direction for practical experiments to reduce the workload of experiments, avoid the white spot issue in future experiments, and improve the efficiency of product development.
Case Study
A simple mold was designed to investigate the occurrence of white spots on automotive ASA parts and develop a prediction method. As shown in Fig. 1, ASA is edge gated and passes through a groove with a depth of 1mm, width of 5mm, and at distance of 20mm from the gate, then the melt enters a plate with uniform thickness. Sixteen process conditions with four different injection speeds and four different melt temperatures are selected and the experiments products show varies degree of white spot.
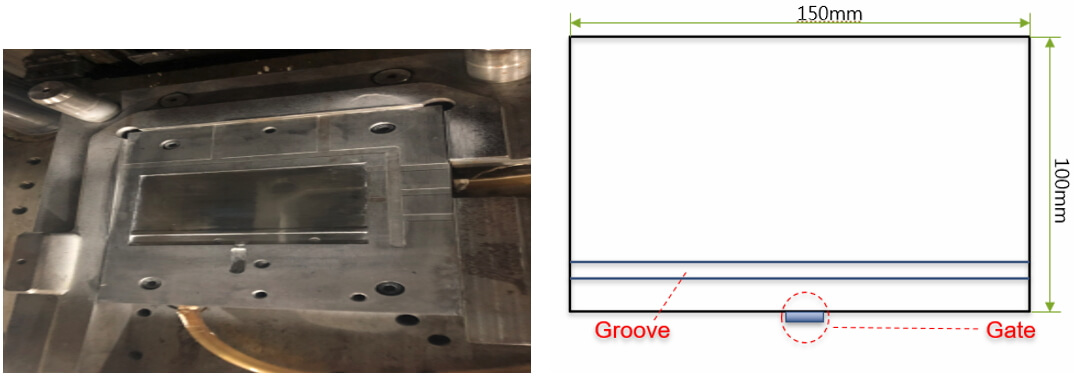
Figure 1:White spot trial mold and simplified diagram
Since the uneven color cannot be removed by wiping with flannel, it can be excluded that white spot is caused by the release of plastic additives. Comparing the simulation results of the products with the most and least server whit spot as shown in Figure 2, there are obviously high Von Mises Stress at the downstream area of the groove, and the Von Mises Stress is much higher in the product with severe white spot than the least one.
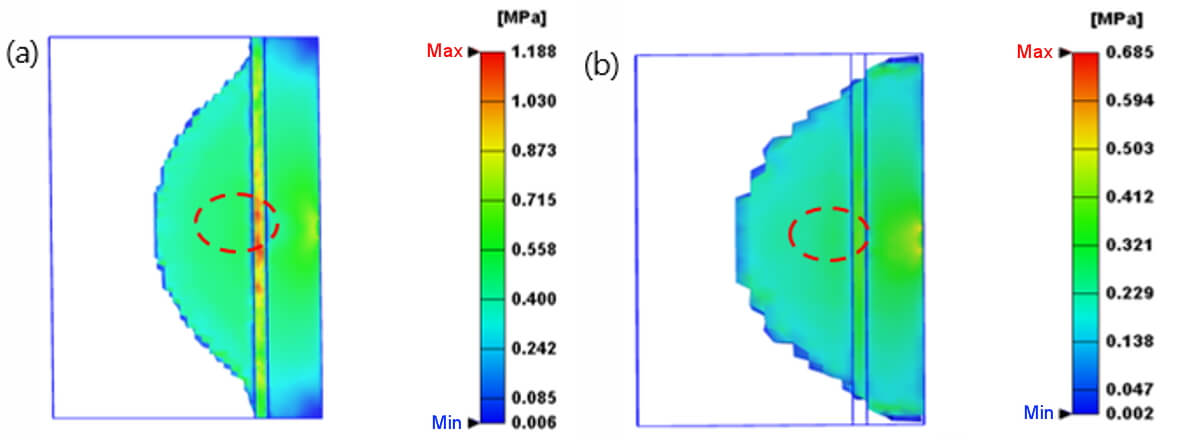
Figure 2:Von Mises Stress (a) Severe white spot (b) Less white spot
Seven sensor nodes were set at the downstream area of the groove. Sensor node 1 is the closest point to groove, and sensor node 7 is the farthest point. The other five sensor nodes in the middle are arranged at equal distance as shown in Figure 3. The results of sixteen process condition show that Von Mises Stress increases rapidly then decreases slowly as the distance between gate and sensor node increases. The maximum Von Mises Stress usually appears at sensor node 2, which is 5 mm from the groove, not sensor node 1, which is closest to groove.
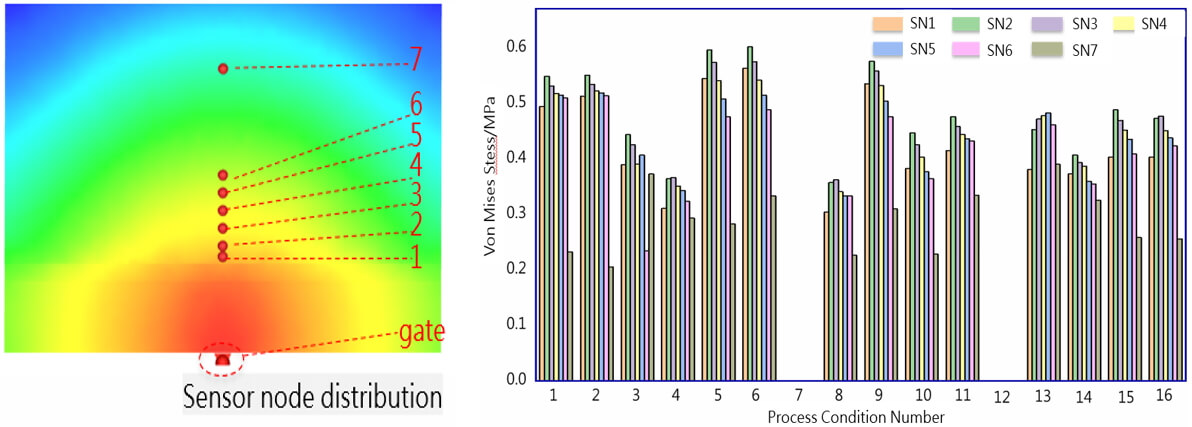
Figure 3:Von Mises Stress at different position
In addition to the Von Mises Stress, the velocity in the thickness direction exhibits a similar trend to the sensor nodes, as shown in Figure 4. The velocity in the thickness direction is significantly different as the sensor nodes get further away from groove. It increases sooner and reduces slowly. The flow field near groove is unstable, and the maximum velocity appears at sensor node 2. The simulation results show that velocity in the thickness direction and Von Mises Stress could be used to identify the white spot issue.
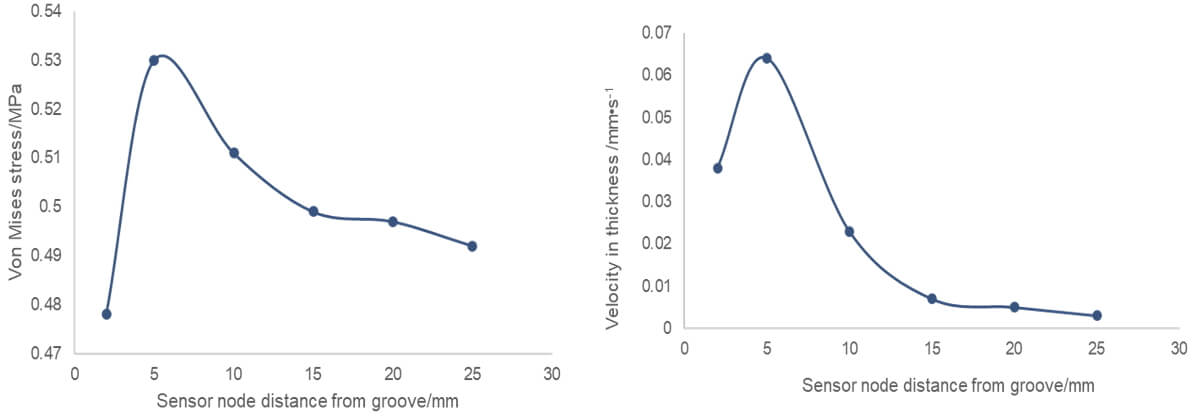
Figure 4:Von Mises Stress and velocity in thickness direction at different sensor node
To find out the key factor of white spot occurrence, four injection parameters, gate thickness, melt temperature, injection speed, and cavity thickness are selected to examine the glossiness of product surface. From the orthogonal analysis of experimental data, the relationship between gate thickness and surface gloss is not significant compared with the other three factors. Cavity thickness, injection speed, and melt temperature are significant factors of surface gloss, in the order of injection speed, cavity thickness, and injection speed. The relationship of each factor and surface gloss is shown in Figure 5.
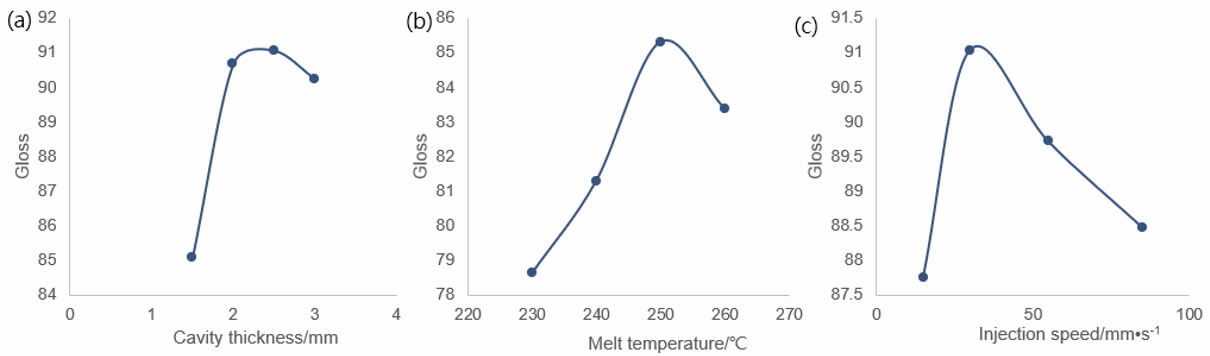
Figure 5:Control factor and gloss trend curve (a) cavity thickness (b) melt temperature (c) injection speed
Comparing the Von Mises Stress of simulation results and gloss from experiments as shown in Figure 6. Correlation analysis shows that surface gloss and Von Mises Stress are significantly related. Therefore, it should be a reasonable and feasible method to estimate the risk of white spot via predicting Von Mises Stress from molding simulation.
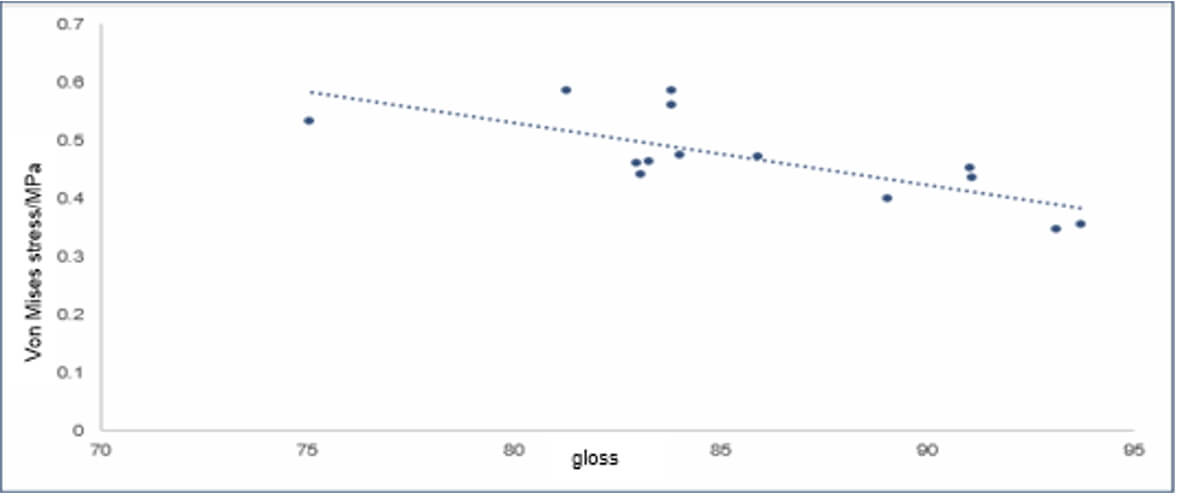
Figure 6:Correlation of Von Mises Stress and gloss
By analyzing the trend of each factor and the impact on gloss, the optimal injection parameters within the given range were obtained via regression analysis: cavity thickness 3 mm, melt temperature 280 degree Celsius, injection speed 15 mm/sec, and gate thickness 2.5 mm. Compared to the original injection parameter with severe white spot, the simulation results of optimized injection parameter show an obviously decrease in Von Mises Stress and velocity in thickness direction in Figure 7. Furthermore, the white spots were eliminated with the optimal injection parameters.
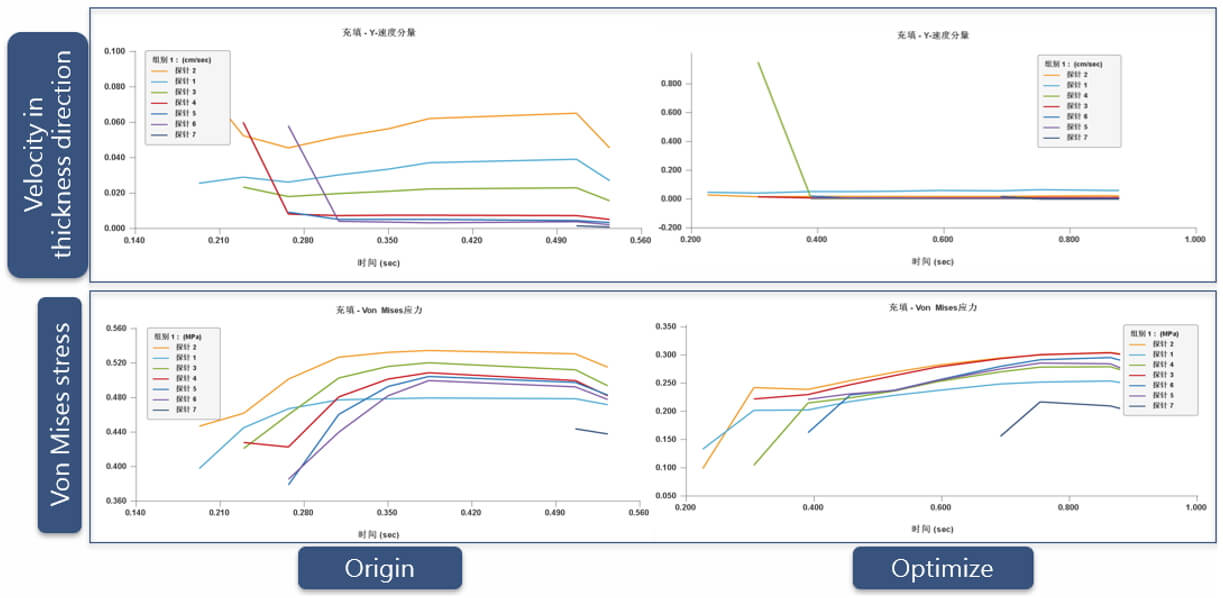
Figure 7:Comparison between original and optimized injection parameters
Results
This study demonstrates that predicting residual stress and velocity in thickness direction can serve as a tool for estimating the risk of white spot. By using the design of experiments method, the correlation between each injection parameter and white spot was identified. The mold design and injection process conditions were then optimized to prevent the occurrence of white spot.