
 |
Tim Chou, Engineer at Product R&D Division of CoreTech System (Moldex3D) |
Molding simulation accuracy is highly dependent on the input conditions. In simulations, normally only the behaviors inside the mold cavity are analyzed without the consideration of the injection unit (Fig. 1). In the injection process, the material is squeezed by the screw, and then flows by the barrel, nozzle, and eventually enters the cavity. The whole process used to be simplified as the ideal flow rate at the inlet. However, this approach ignores the material property changes that occurred inside the barrel and nozzle, which will affect the reality of flow rate, temperature, and viscosity at the inlet. Thus, manufacturing condition differences between simulation and reality initially exist. To eliminate this gap, the simulation inside the barrel is very critical.
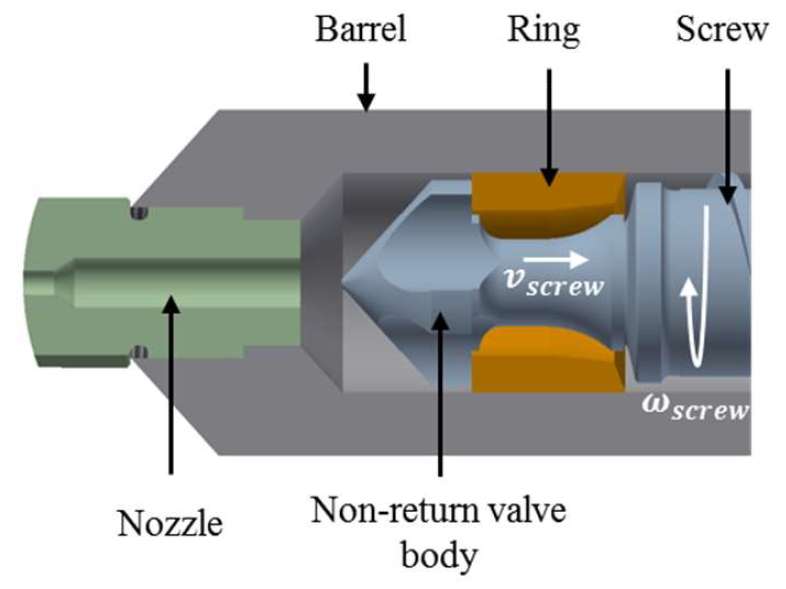
Fig. 1 The injection unit [1]
In traditional simulation, the screw’s force imposed on the melt is simplified into the converted flow rate. To comprehensively consider the dynamic behaviors the screw squeeze has on the melt, we have to input the barrel and nozzle simulation in the analysis process. Based on the PVT property and the simulated compression, the material density change under the pressure inside the barrel and nozzle can be described as below[2]:
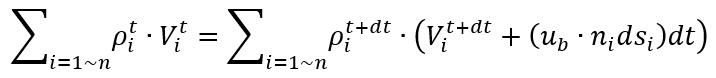
In this formula, ρ is the density, V is the specific volume ub is the speed, dsi is the area, and dt is the time step.
During the process when the melt is being squeezed into the cavity by the screw, the material is compressed, its specific volume becomes smaller, and the volume flow rategradually decreases. Also, when the melt flows through the narrow nozzle, it is heated by intense shear heating. As shown in Fig. 2, the material has increased from 190℃ to 195℃ while flowing through the nozzle. Higher temperature distribution can also be observed on the inner wall of the nozzle. The material at the rear end of the barrel has a longer distance to the inlet, so it will be more affected by sheer heating. As the result, when the melt with higher temperature flows forward, the temperate of the material entering from the nozzle into the cavity will get higher (Fig. 3). If we do not consider this impact from the barrel and nozzle, differences between simulation and reality will occur.
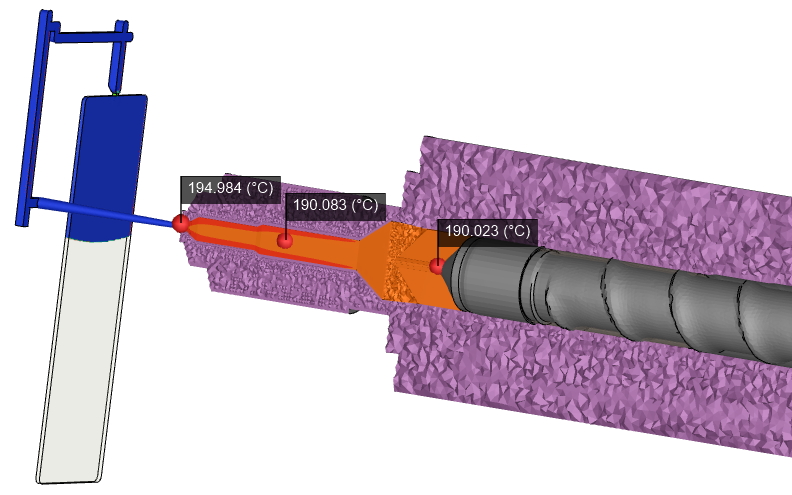
Fig. 2 The temperature distribution of the barrel and nozzle
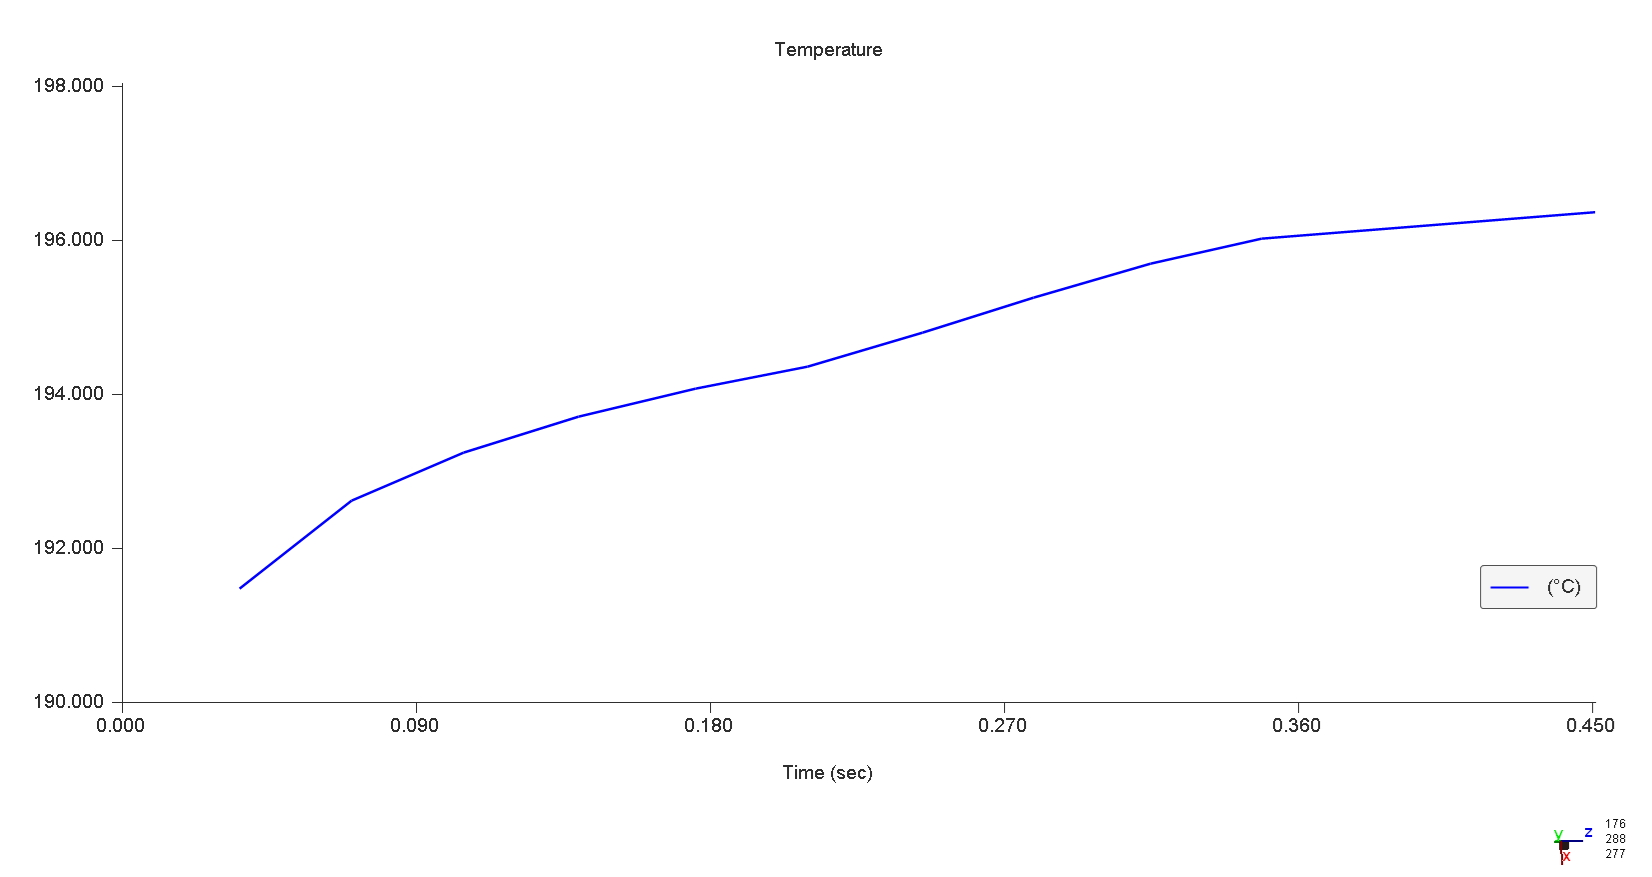
Fig. 3 The nozzle temperature distribution with time
Through Moldex3D, users can simulate the real behaviors of the melt being squeezed inside the barrel through modeling the Nozzle Zone. With this technology, we can simulate how the compression in the barrel affects the material-specific volume, as well as the injection pressure. As shown in Fig. 4, the flow rate at the screw tip is lower than the flow rate near the nozzle. The better the material compressibility is, the more apparent the flow rate difference between the two locations is. The accurate flow rate data will help improve the problems that both early estimated cavity filled time and VP switch in the simulation. As shown in Fig. 5, the pressure difference between the screw tip and nozzle is around 5MPa. Without considering the barrel and nozzle, this 5MPa pressure would not be displayed, and the simulated injection pressure would be lower than the reality.
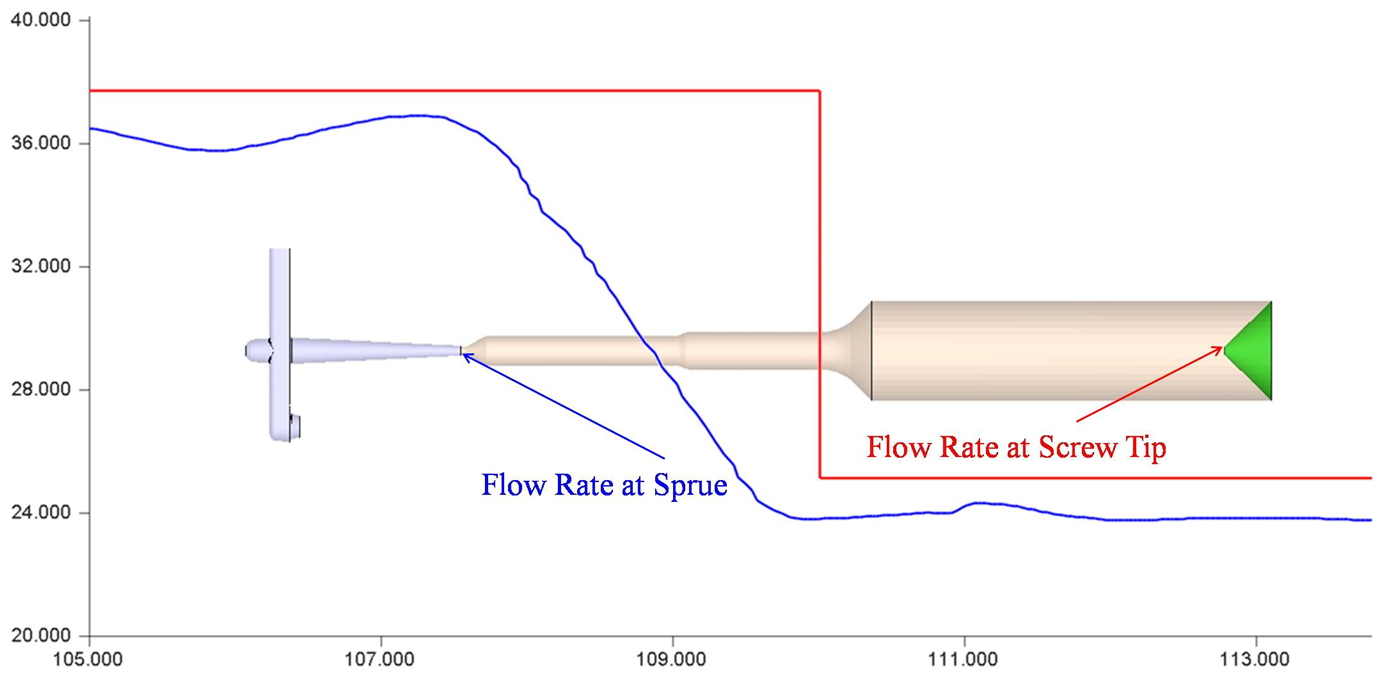
Fig. 4 The flow rate changes caused by barrel compression
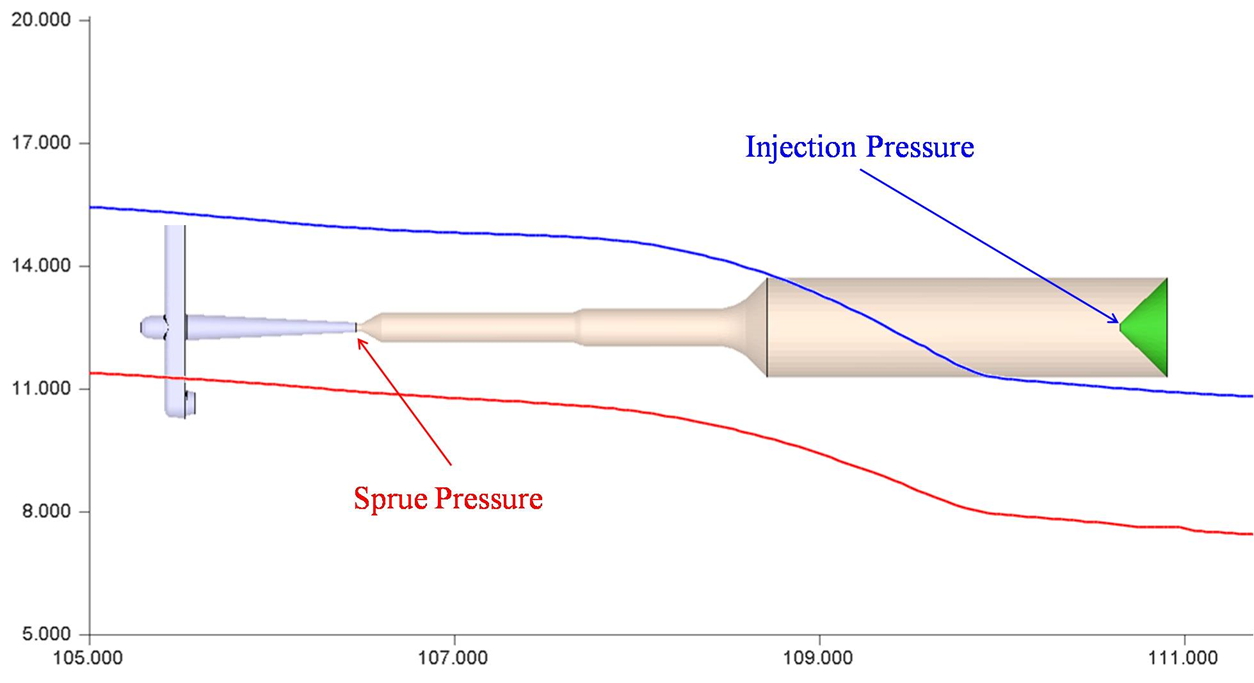
Fig. 5 The inlet pressure and injection pressure
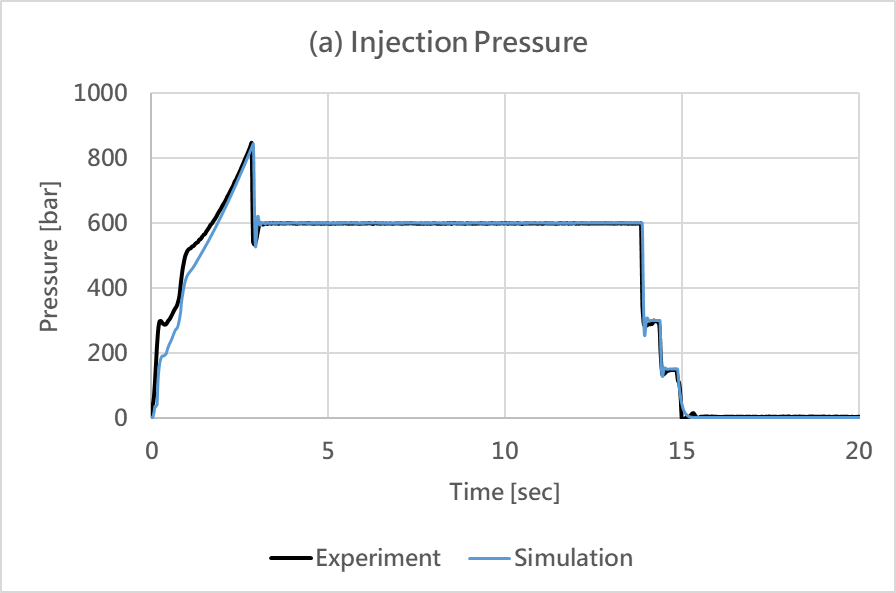
The short shot comparison of simulation and experiment is shown in Fig. 6, in which we can see good consistency between simulation and experiment under three different ram positions. The injection pressure comparison is shown in Fig. 7, the peak value of experimental and the simulated pressure is 846 Bar and 845 Bar, showing high consistency between the two. In this case, the packing switch point is set at the time that the cavity is almost filled, which is right before it is too late that the pressure sharply increases and is suitable for verifying the simulation accuracy. In Fig. 7 (b), we can see the moment of VP switch, the simulated injection pressure does not rapidly increase, meaning no earlier full filled the cavity in simulation. The value is also close to the experimental value, proving that the material flow in the barrel and nozzle will greatly affect its in-mold behaviors.
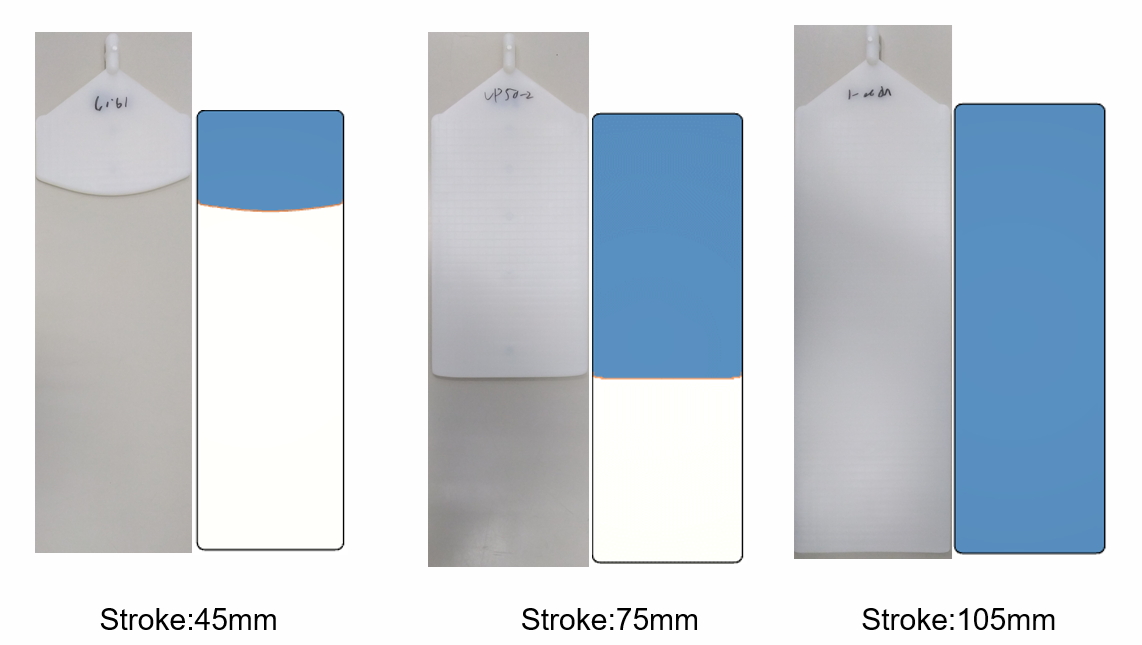
Fig. 6 The comparison of the experimental and simulated short shot
 |
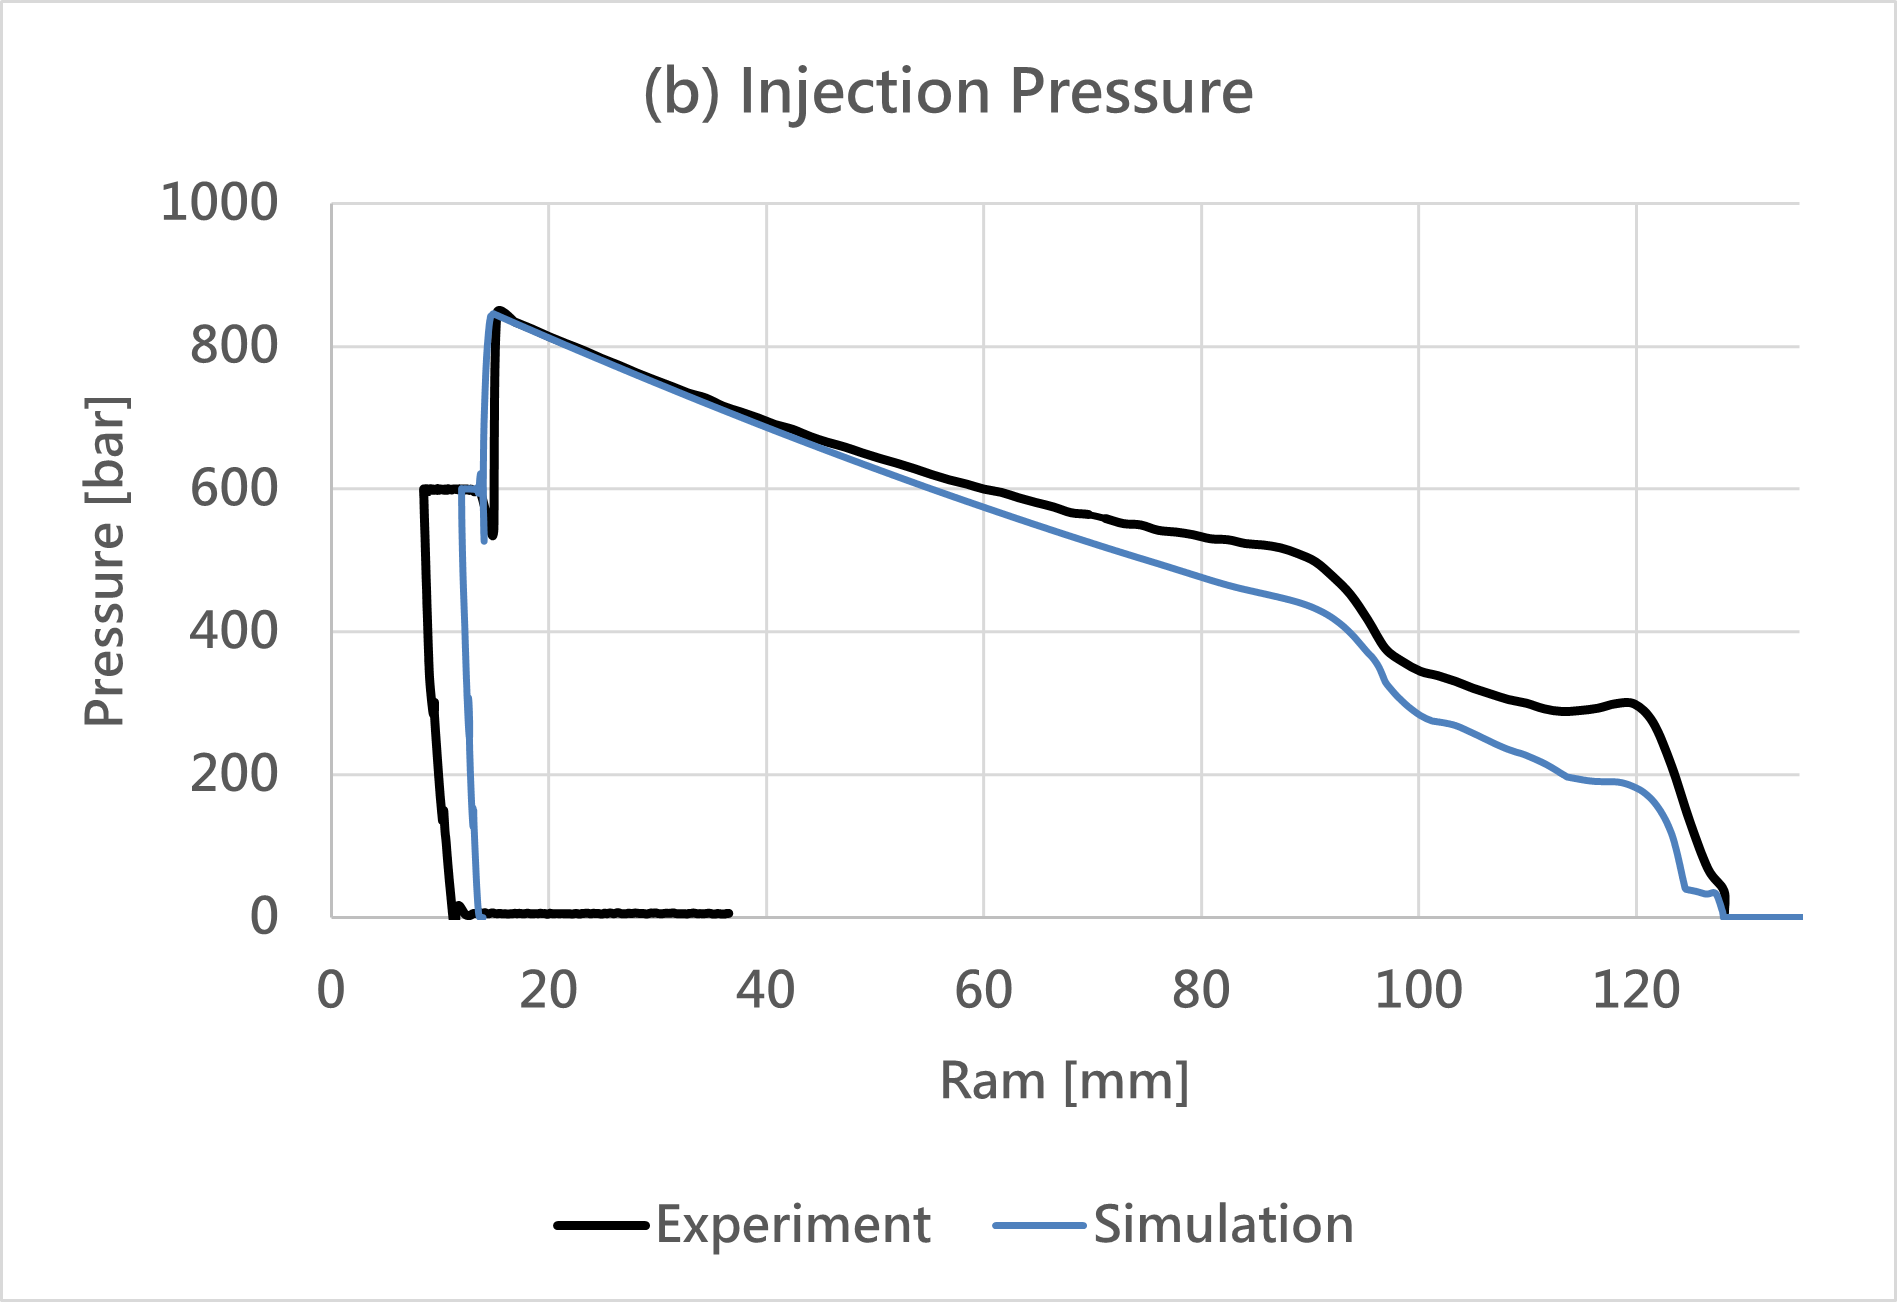 |
Fig. 7 The comparisons between injection pressure and (a) time and (b) screw location
To ensure the molding simulation accuracy, we need to minimize the difference of the conditions between the reality and simulation. As illustrated in this article, the simulation considering the barrel and nozzle can help us attain a more realistic flow rate and material temperature, enhance the simulation consistency to reality, and further manufacture the optimized products.