
Jill Chen, Deputy Administrator at R&D Division, Moldex3D
Introduction
Generally, the complete injection molding product life cycle, starting from plastic part design, mold manufacturing and pre-production trial stage, often requires a substantial amount of data parameters and technical insights. Consequently, if team members rely on traditional paper-based recording during the development process, they could encounter challenges such as difficult management, delayed information, or increased errors propensity. To solve the inconveniences caused by paper-based records, Moldex3D has released the iSLM data management platform orientated toward organization for mold design and plastic molding. This platform aims to assist development teams in documenting the entire design process and organizing all data together throughout the workflow. Through visual presentation, it provides a clear overview of the complete development process and associated data, enhancing the team’s efficiency.

Fig 1. The iSLM data management platform assists in recording complete plastic injection process
The Importance of Data Visualization
Various data stored and recorded in the iSLM platform are crucial assets in the injection process. Therefore, transforming this vast and complex data into more understandable forms such as graphics and charts can be beneficial for the team.
For instance, the project management feature in the platform, specifically Quality Dashboard transform invisible expertise of CAE expertise into tangible design guidelines for product design lifecycle. This is then applied to the CAE analysis workflow, assisting the team in analyzing results and setting parameters, thereby enhancing production efficiency, and exploring more possibilities. In the task management feature, individual tasks are differentiated by colors to indicate conditions, offering visual effects on the page. This virtually manages individual or teamwork progress, facilitating easy tracking of tasks. The new dashboard features released in 2023 provide a more advanced, comprehensive way of managing data. It revitalizes mundane and complex data by presenting it through various types of charts, offering vitality to the information. This allows the team members to not only view pleasant and practical business information but also quickly gather insights and changes in the data.
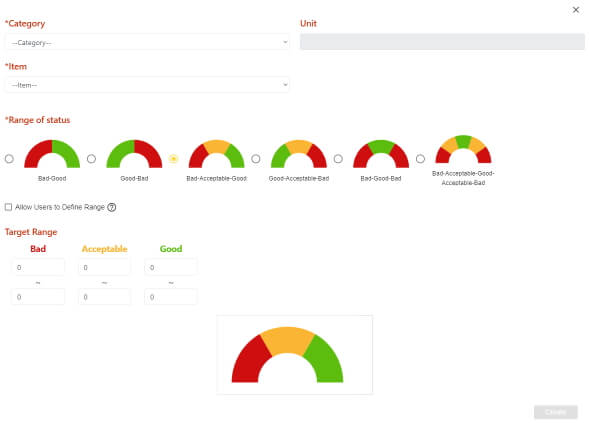
Fig 2. The quality dashboard creation window
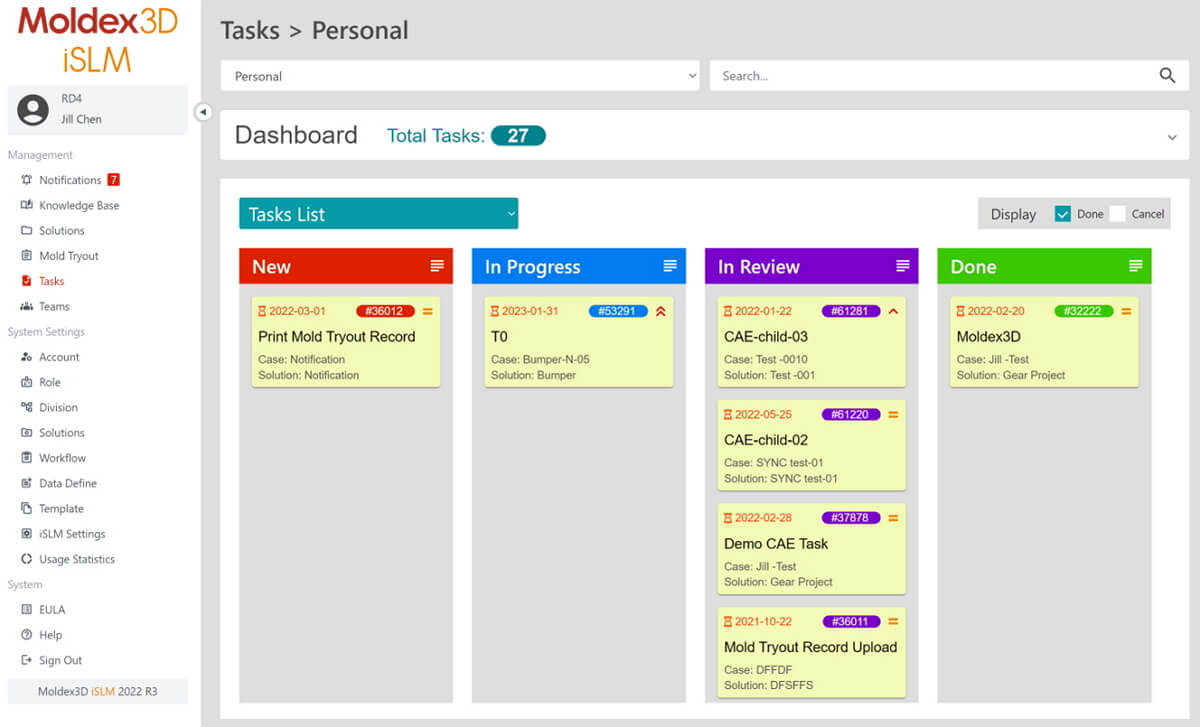
Fig 3. Tasks management page in iSLM platform
The Explanation of iSLM Dashboard Management Features and Application
How can the dashboard management function in iSLM provide substantial assistance? Imagine if we needed to conduct data research or advanced research in iSLM knowledge base like AI and machine learning. We could filter specific projects according to requirements then export them as CSV data reports.
However, if we need to generate regular weekly updates of data, the repetitive process of filtering projects, exporting CSV reports, and updating data can be quite inefficient from a management perspective. Therefore, the new dashboard management feature in iSLM allows users to create charts first and then visually display the data stored in iSLM in real-time, synchronized manners for team members to view. This approach aids in visualizing data collection and achieving goals of personalizing data application.
Using the custom chart creation feature mentioned above, users can choose from nine different chart types such as pie charts, line graphs, radar charts, etc. Next, they can decide whether to set filtering conditions based on requirements. Once created, team members can review these charts on the dashboard management page.
On the other hand, in the dashboard management, related charts can also be grouped together. Viewing these charts as a group can provide key information at a glance. The following will introduce several examples of dashboard features:
- The Data Comparison of CAE and Trial Molding
Besides simulation data, mold tryout and CAE data can also be displayed on the dashboard page. Taking the example of designing and producing a car bumper, the sample below provides users about how to design runners and select data when creating models. Moreover, it offers a comparison between simulation results and trail molding outcomes. Through this information, team members can more accurately identify production obstacles and pinpoint crucial areas for improvement.
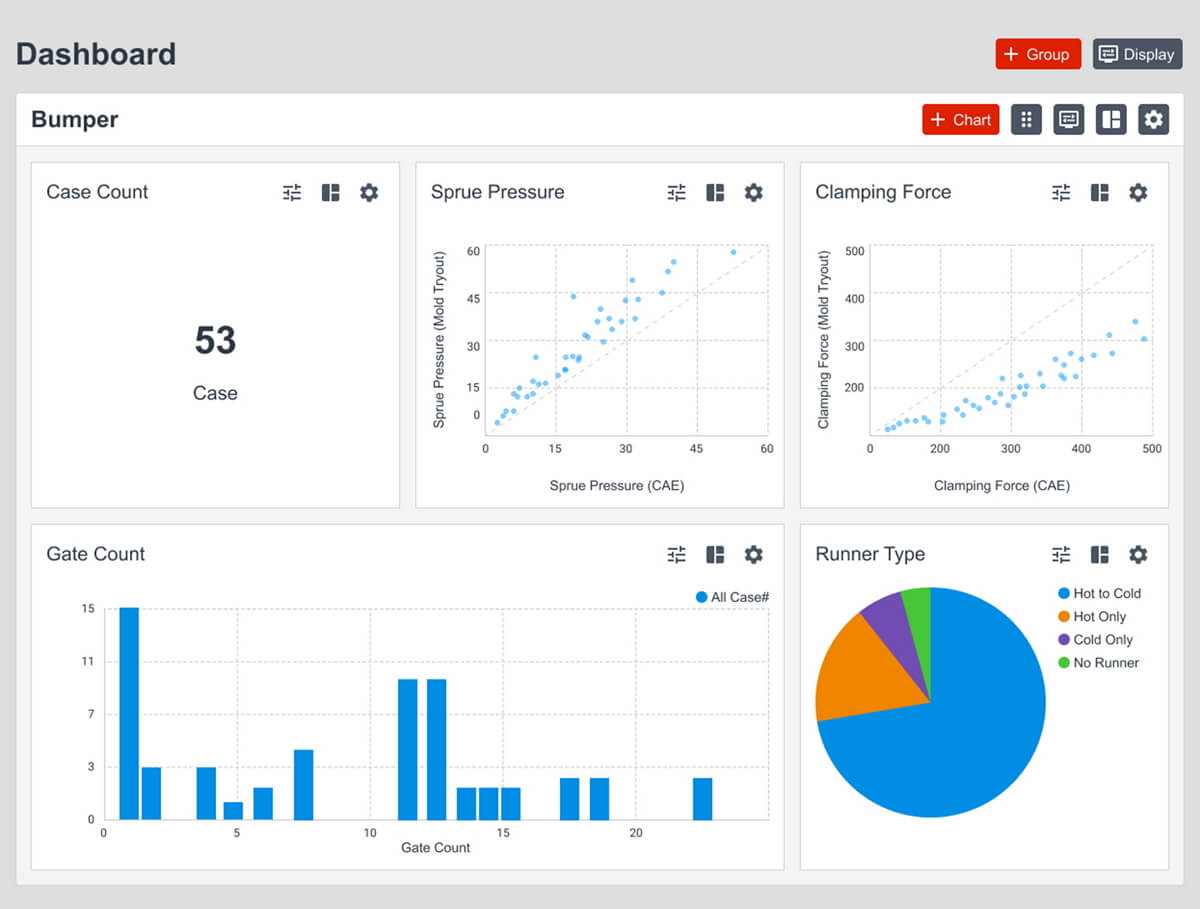
Fig 4. Dashboard for comparing CAE and mold tryout data
- Statistical Data for Management Level
Managers can monitor current project status and implementation across departments by creating relevant charts, effectively track project progress, and ensure the smooth execution of tasks. The figure below illustrates data statistics designed from a project management perspective. This example includes details such as the number of cases in iSLM, product categories, creation times and responsible departments. Users can access development data through the web and grasp all information in real time.
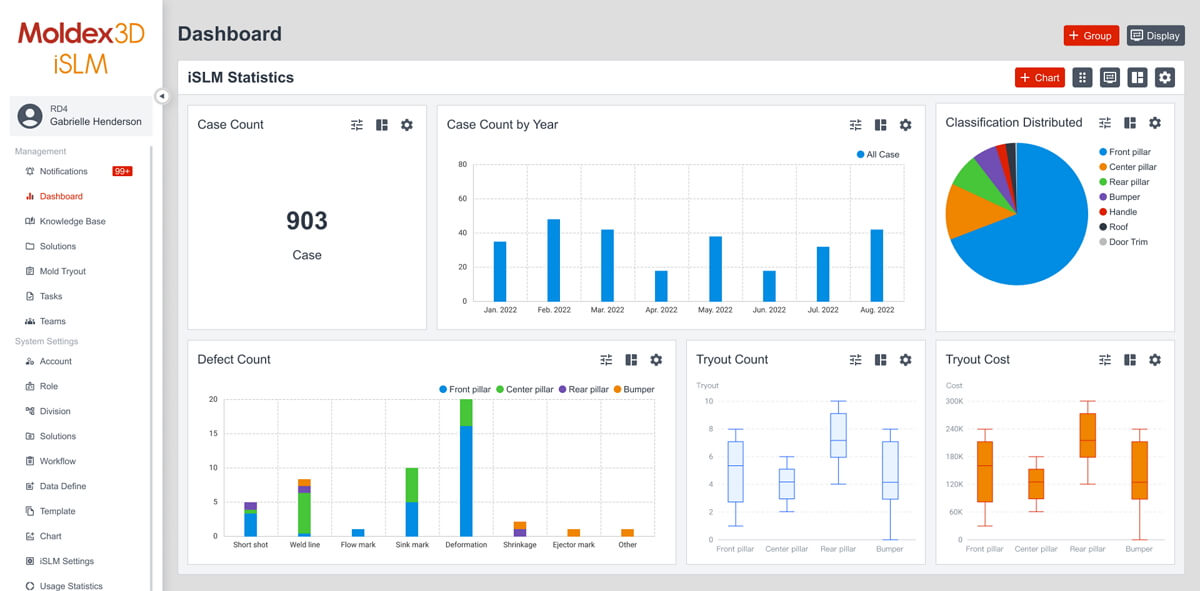
Fig 5. Dashboard of statistical data for management level
The Correlation Between AI Development and Data Collection
Through the thriving development in technology, AI applications are pervasive and gradually change our life and work. As with most popular topics in the current technology area, the future trends of AI includes “automation and machine learning,” “AI and big data,” “natural language processing,” “AI and Internet of Things (IoT),” and more. From these trends, it’s evident that whether it’s machine learning, big data or IoT, abundant data collection is crucial. The more data, the stronger AI model learning capabilities. However, it’s not just about the quantity, the quality of data is also important.
Poor-quality data can lead to useless or even wrong results. Therefore, collecting high quality and numerous data is critical for AI development.
Conclusion
Visualizing massive and complex data stored in the iSLM platform into digestible and understandable visual content can assist AI technology in data collection. Simultaneously, it makes it easier to identify data patterns, trends, and relationships. It also enables development team to make manufacturing and production decisions precisely and quickly. The existing quality dashboard scoring criteria and task management card tracking not only provide benchmarks for parameters setting but also increase the manager’s efficiency. Furthermore, dashboard features can also support team members in accessing data via online web, breaking the limit of time and space, ensuring users will obtain all synchronized updates. Moreover, by combining virtual and real data, visualized data can be applied to cross-mold project data display, assisting team members to compare collected data and achieve personalized intelligent data application goals.