
Ethan Chiu, R&D Director of CoreTech System (Moldex3D)
Product deformation evaluation is critical in design cycle, whether is in initial design phase, mid-term mold tryouts validation, or later stages of design modifications. Unfortunately, warpage prediction is very complex, including material properties, product geometry, mold design and processing conditions, among other factors. Therefore, to ensure the quality of warpage prediction in injection molding CAE tools, it requires not only a theoretical framework and computational accuracy in the Solver itself but also reliable material database and actual molding data for parameter calibration. The following will explain how molding simulation software ensures the foundational engineering required for warpage prediction.
Continuously Expanding Investments in Molding Center to Acquire Real Molding Data
Moldex3D molding center is equipped with an Arburg injection molding machine and a highly precise mold of large plate. This mold is installed with 9 pressure sensors and 9 temperature sensors. Additionally, the injection unit has been modified with one pressure sensor and one temperature sensor at the nozzle location, as shown in Figure 1.
In the standard validation process, the comparison items typically include:
- Compare the pressure curves at the nozzle with the predicted pressure curves from molding analysis, obtaining their trends and quantitative differences.
- Match the results from pressure sensors inside the mold with the predicted curves of pressure and temperature variations from molding analysis.
- Compare the relationship between screw position and the filling front position. Compare each aspect with molding simulation software.
- Match the product weight.
- Compare the shrinkage values in the flow and its vertical directions.
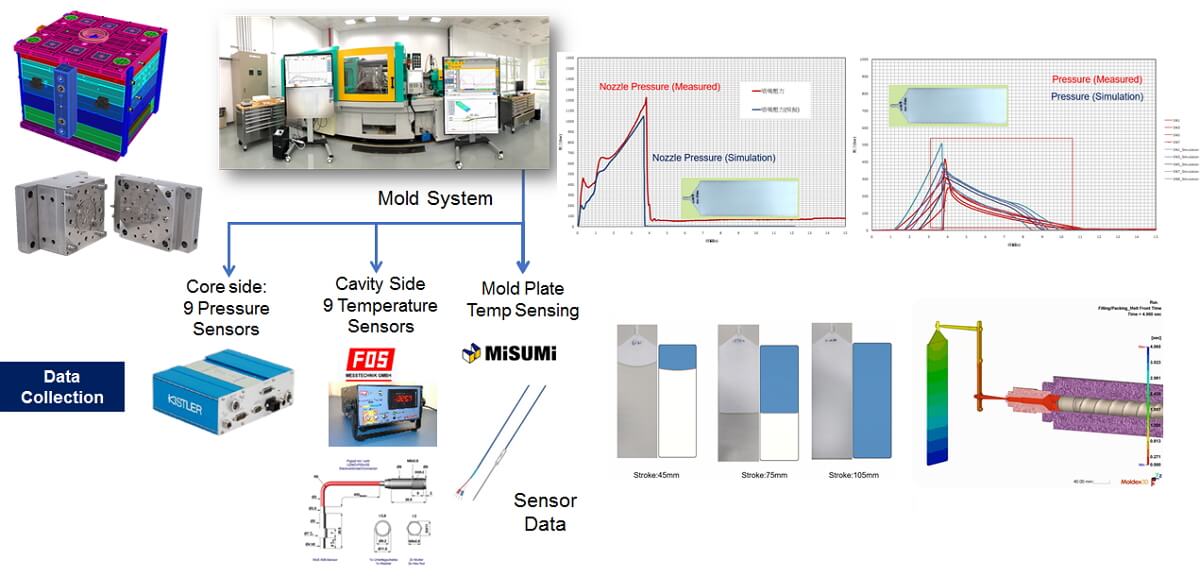
Fig 1. Moldex3D Molding Center
In this process, the data can be used to confirm the differences between molding simulation results and experimental results for polymer materials. Such data also provides the molding analysis software with information for parameter fine-tuning and optimization, which can significantly benefit subsequent warpage analysis.
Reliable Material Database
We are aware that there are numerous factors influencing warpage during the molding process, such as product geometry, mold design, and process conditions. However, one of the most crucial factors is material parameters. For polymer materials, these parameters encompass rheological properties, thermal properties, viscoelastic properties, and mechanical properties. In the case of crystallization materials, considerations extend to crystallization theory models and parameters, with and warpage as is the ultimate result. For current Moldex3D material database, which is comprised of 9000 materials, how can we ensure the prediction quality for this extensive range of materials? Moldex3D Material Center utilizes tools including Studio API to create an automatic process to evaluate the prediction quality of each material. Taking Figure 2 as an example, this represents a virtual test dimension for the STD standard plate. The horizontal axis represents the different material suppliers for PP in the material database, while the vertical axis shows the shrinkage data of the STD standard plate after molding analysis. For PP materials, typical data sheets provided by material suppliers indicate molds shrinkage compensation in the range of 1.2% to 1.7%. Upon comparing the automatic scan of all PP data in the material database, it can be observed that over 95% of the materials currently fall within the expected shrinkage range provided by the suppliers. Only a few materials exhibit outlier performance. This not only helps Moldex3D verify the quality of the material database but also enhances the reliability to users in the Moldex3D material database.
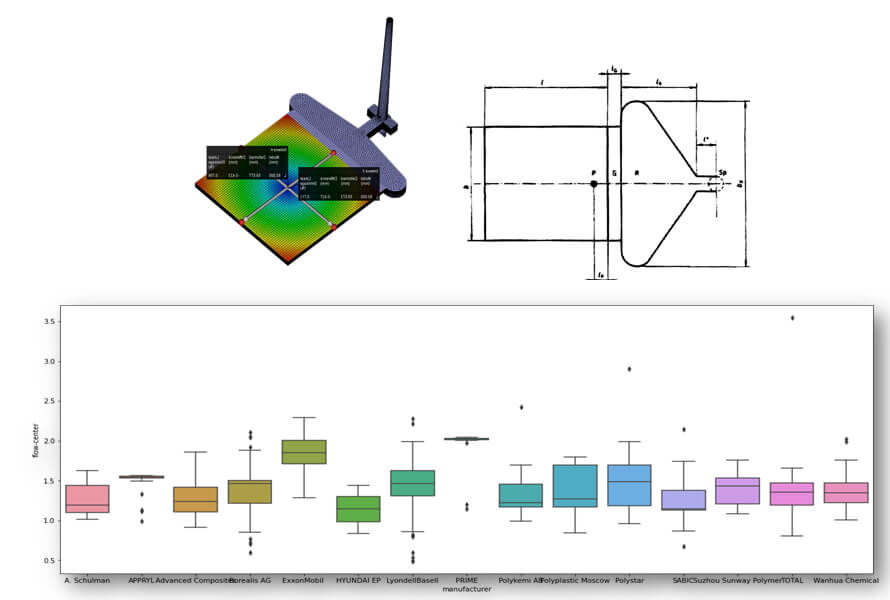
Fig 2. Automation of small plate testing
Comparison of Molding Data- Product Weight
On the other hand, concerning the molding simulation analysis and actual molding data, Moldex3D Molding Center will record product shape, weight, and shrinkage rate. Fig 3 represents the actual product shape, with the dimension of flat plate being 300 mm x 100mm x3 mm. Let’s start by comparing with the most widely used PP material in the injection molding industry. The comparison results of actual weight versus simulated weight are organized in the Fig 4, the horizontal axis represents the product weight data from experiments, and the vertical axis represents the product weight data from simulation analysis. The data points are marked with blue dots, and the gray line represent completely accurate data. It’s evident that the blue points are very close to the gray line, with an average deviation of about 1%.
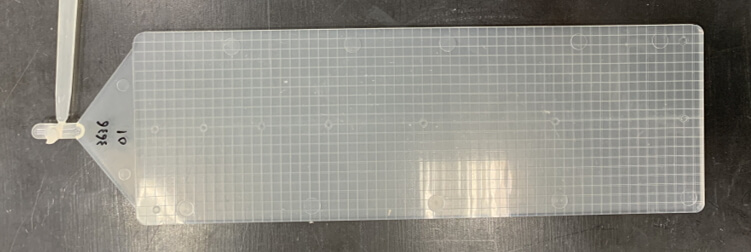
Fig 3. Actual product
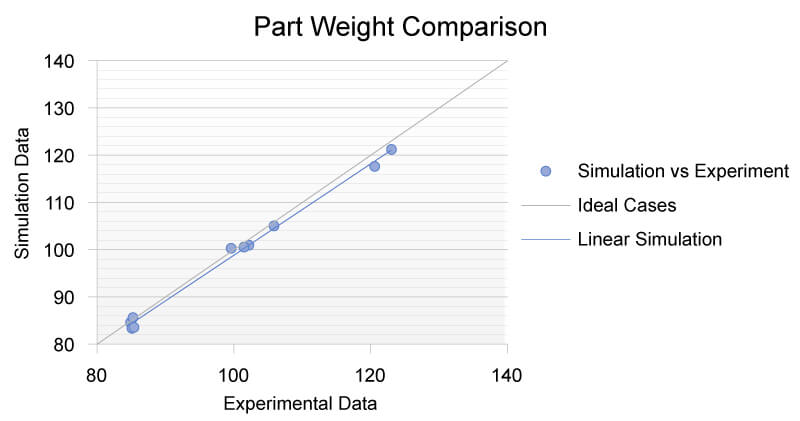
Fig 4 Part Weight Comparison
Following the demonstration above, Moldex3D emphasizes the quality of material database from the accuracy in the comparison between simulation and actual molding. Therefore, we will invest in the molding center continuously and develop molds with geometric features to offer more items for simulation and on-site comparison. In terms of material database, it serves as a critical foundation for CAE simulations. We will continue to ensure the quality of material database, providing data with reliable parameters for users. Additionally, establishing the test process for the STD standard plate, prior to release, the material database and software solver compatibility can provide highly accurate warpage shrinkage predictions. We anticipate that users of molding analysis can effectively reduce the number of mold modifications and development costs.