The AI Optimization Wizard in Moldex3D Studio helps users tackle high-dimensional, multi-objective optimization problems with constraints. When the relationships between parameters are unclear or simulations are computationally expensive, the feature helps quickly identify optimal solutions early in development. Users can define the ranges of the control factors and the target values of the quality factors. Over multiple iterations, the wizard continuously adjusts parameters within the defined ranges, automatically corrects its search direction, and gradually converges to the optimal solution. This helps users focus on promising regions and improves efficiency.
The article demonstrates how to use the AI Optimization Wizard through the following scenario:
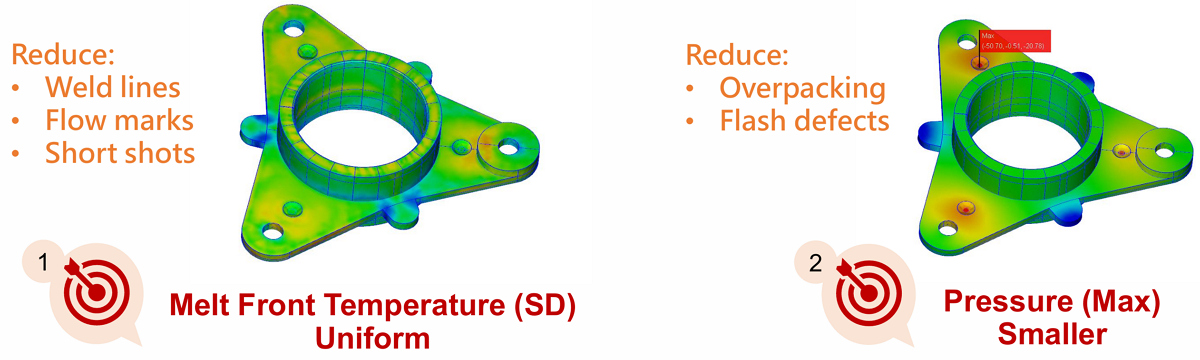
The first goal is to improve melt front temperature uniformity, which reduces defects such as weld lines, flow marks, and short shots. The second goal is to lower the maximum pressure to prevent problems such as over-packing and flash. To meet both goals, two key quality factors are selected for optimization: the standard deviation of the melt front temperature and the maximum pressure. Optimizing these two indicators further improves overall product quality and molding stability.
Step-by-step Procedure
Pre-requisites
- An EXPERT license is required.
- A base run with complete settings must be prepared in advance.
- Only specific processes are supported: Injection Molding (IM), Powder Injection Molding (PIM), IC Packaging (IC), and Foam Injection Molding (FIM).
Step 1: Create a Base Run and Open the AI Optimization Wizard
Create a new project and complete all required settings, including mesh, material, and process conditions, to establish the base run. The AI Optimization Wizard can be accessed in either of two ways:
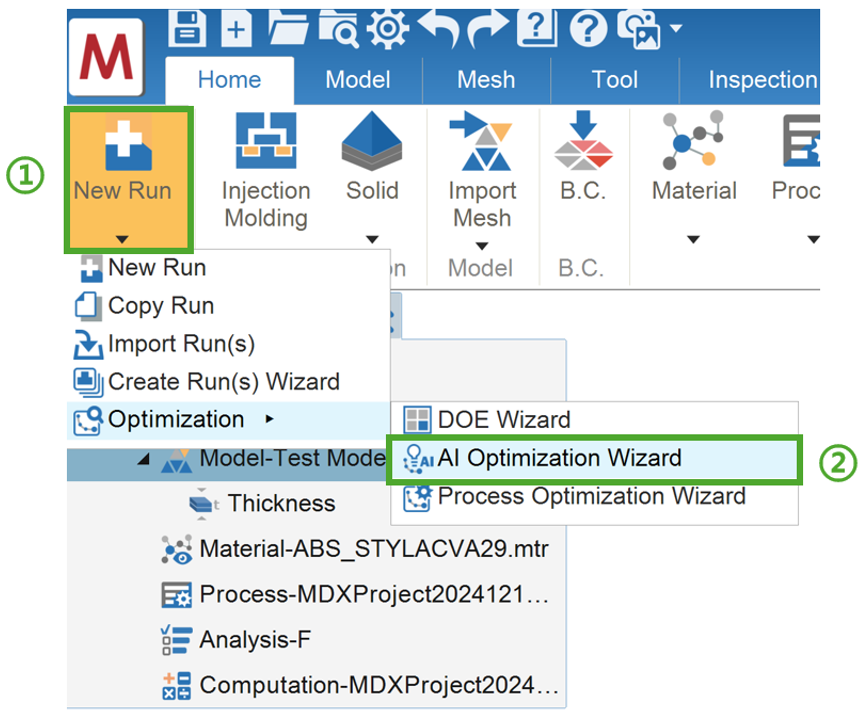
- On the Home tab, open the New Run drop-down menu and select AI Optimization Wizard.
- Right-click the run and select AI Optimization Wizard.
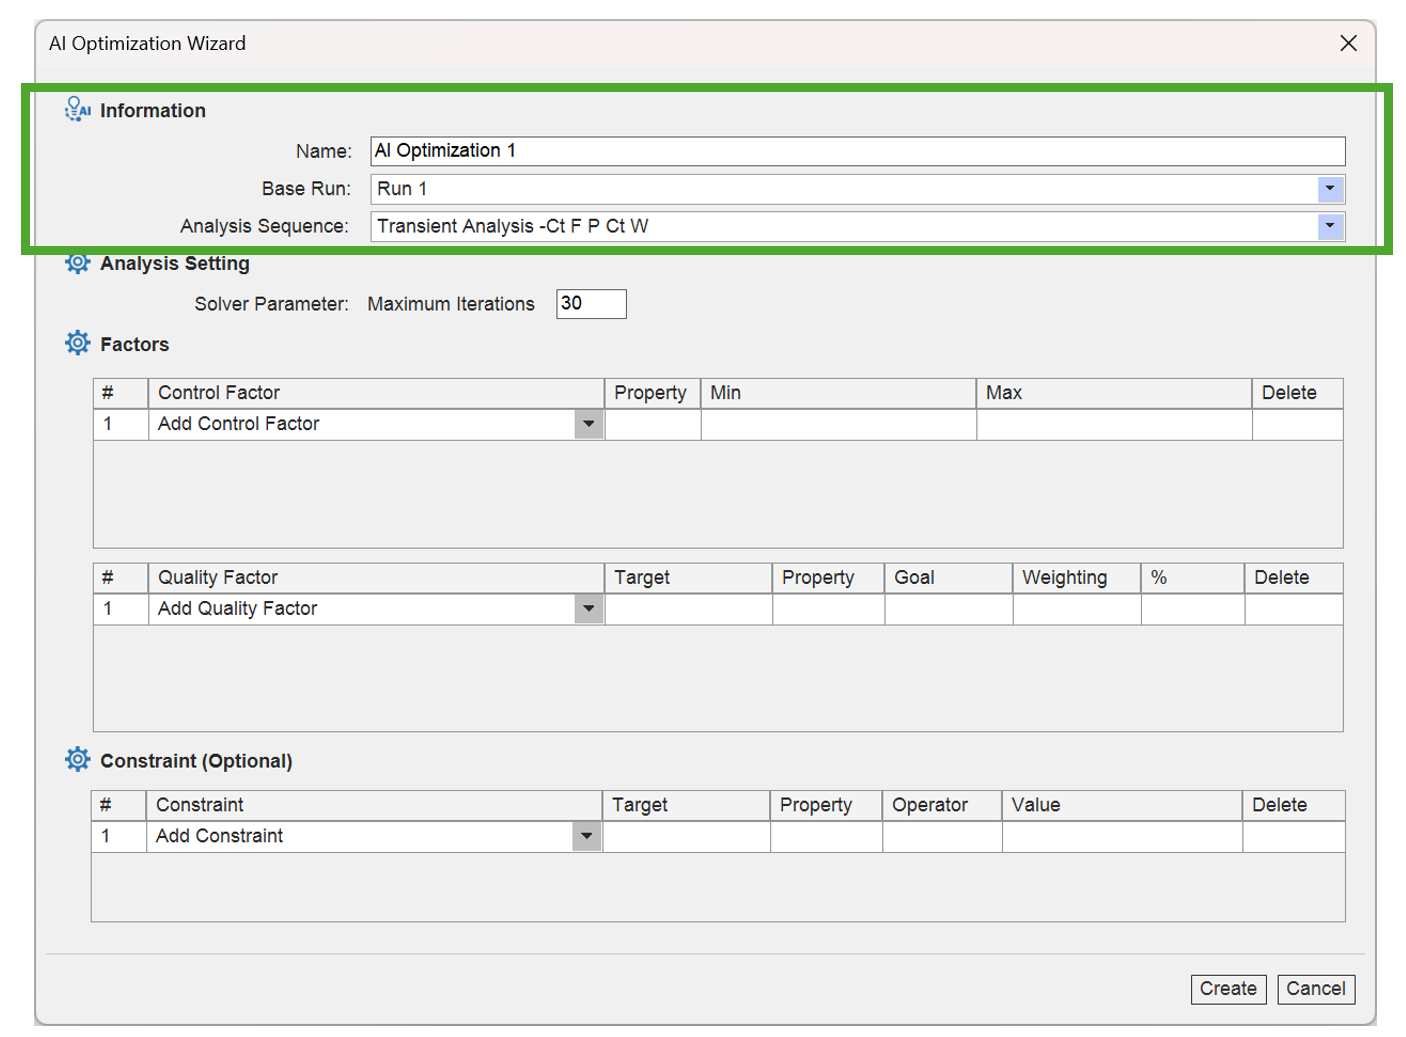
Then, complete the information setting, including the project name, base run, and analysis sequence.
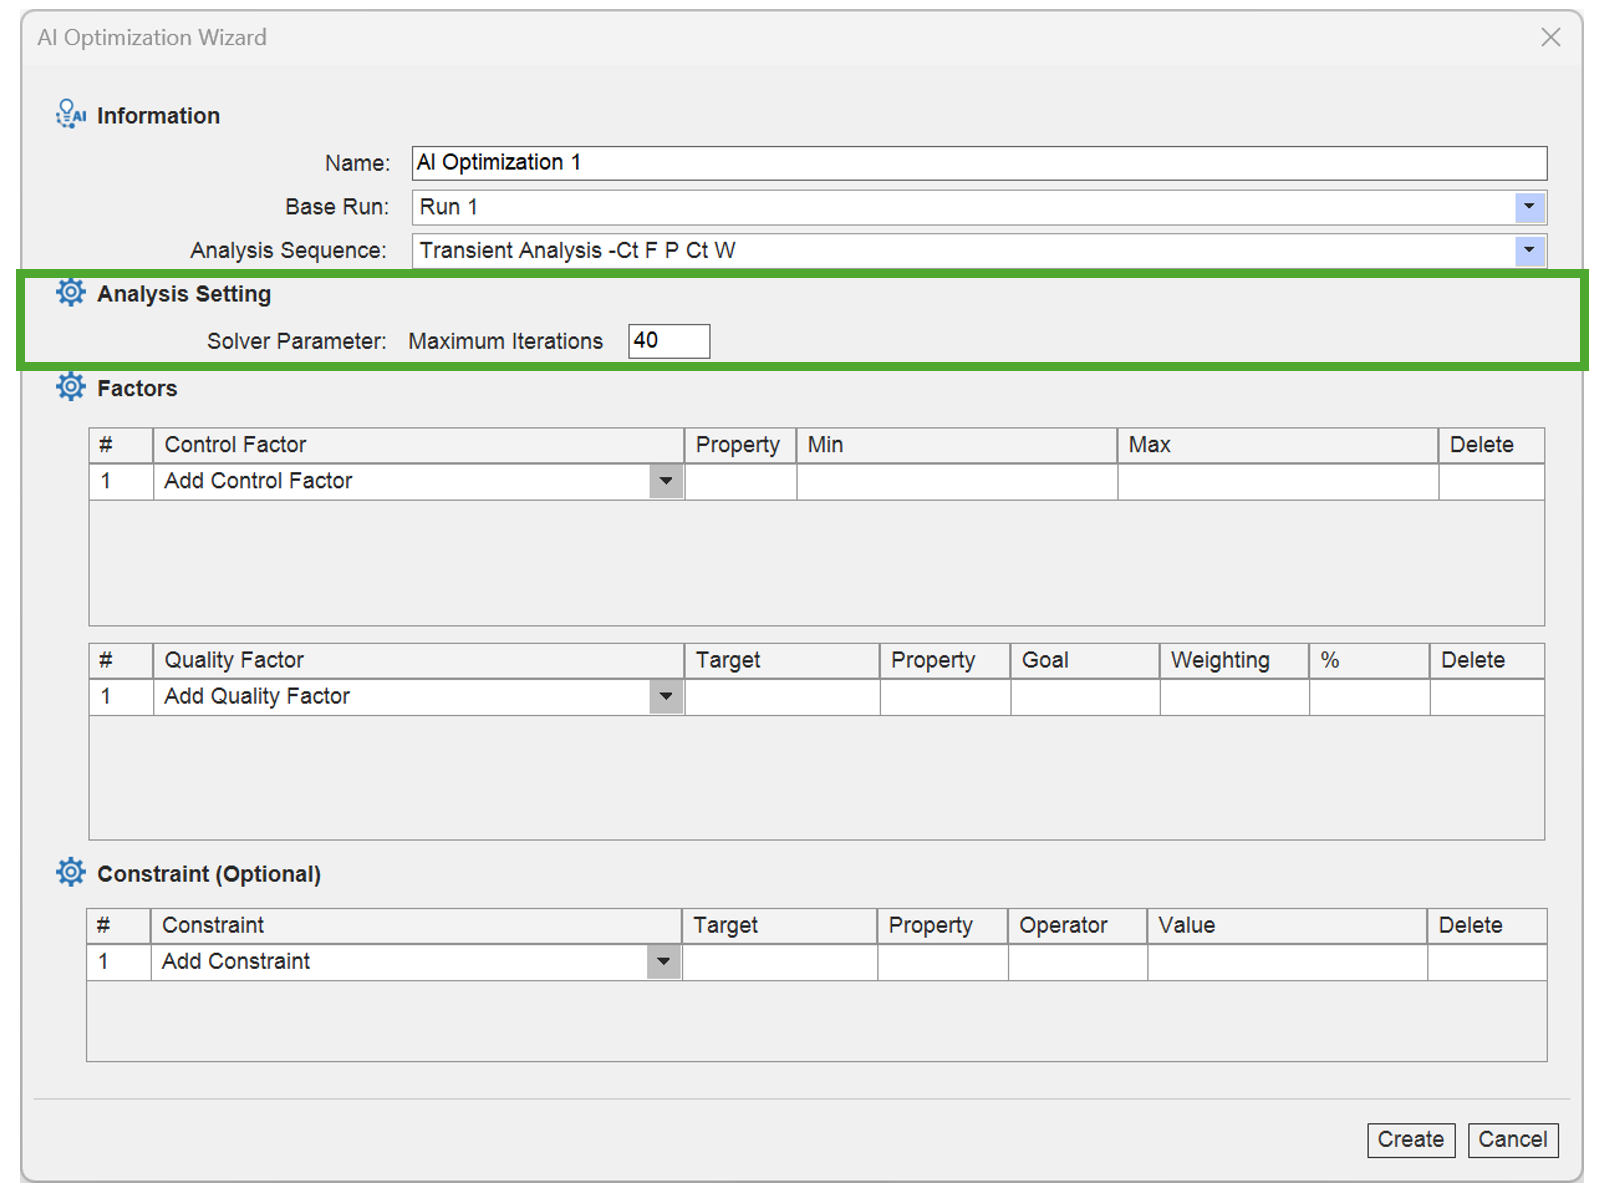
Step 2: AI Optimization Wizard — Analysis Setting
Define the maximum number of iterations. The value depends on the number of control factors and the problem complexity.
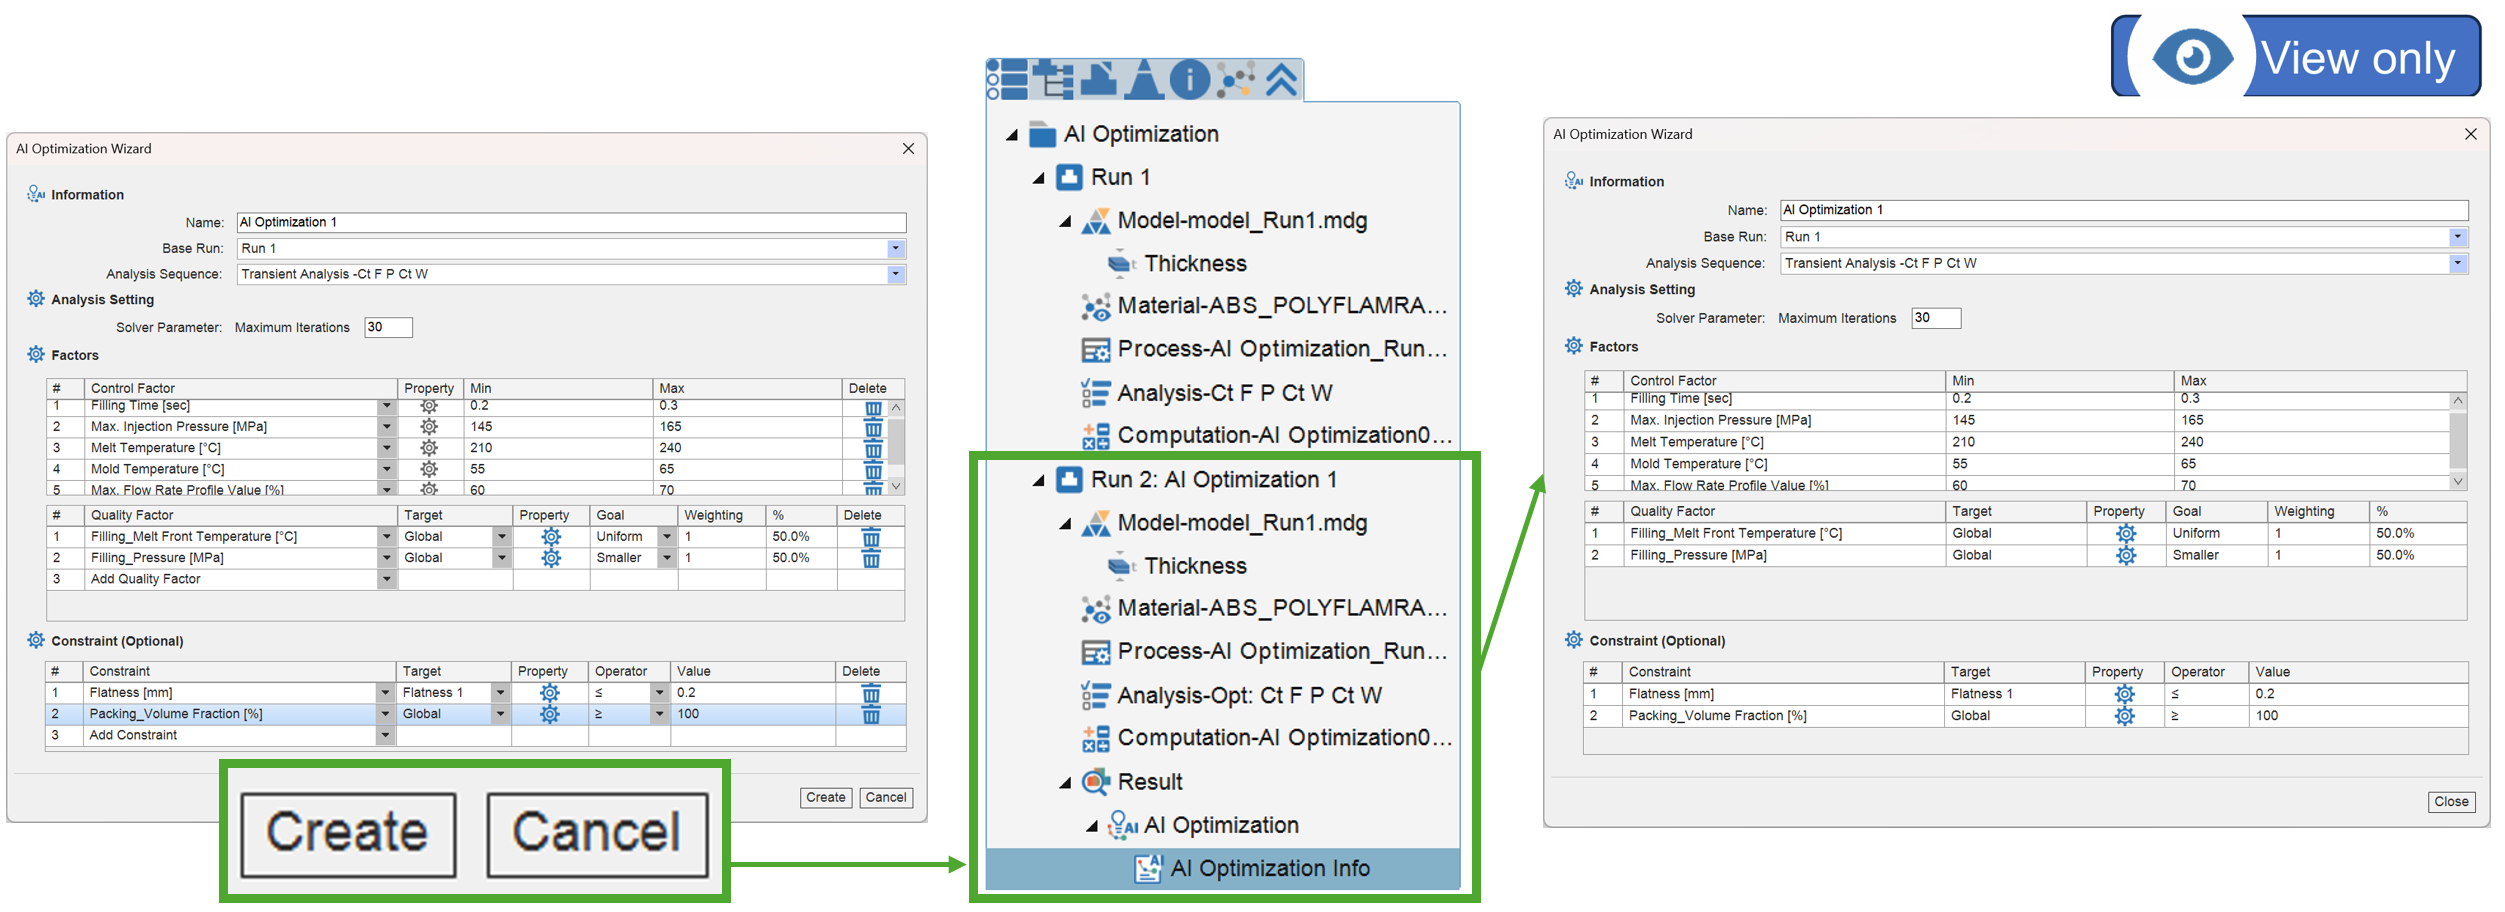
Step 3: AI Optimization Wizard — Factors
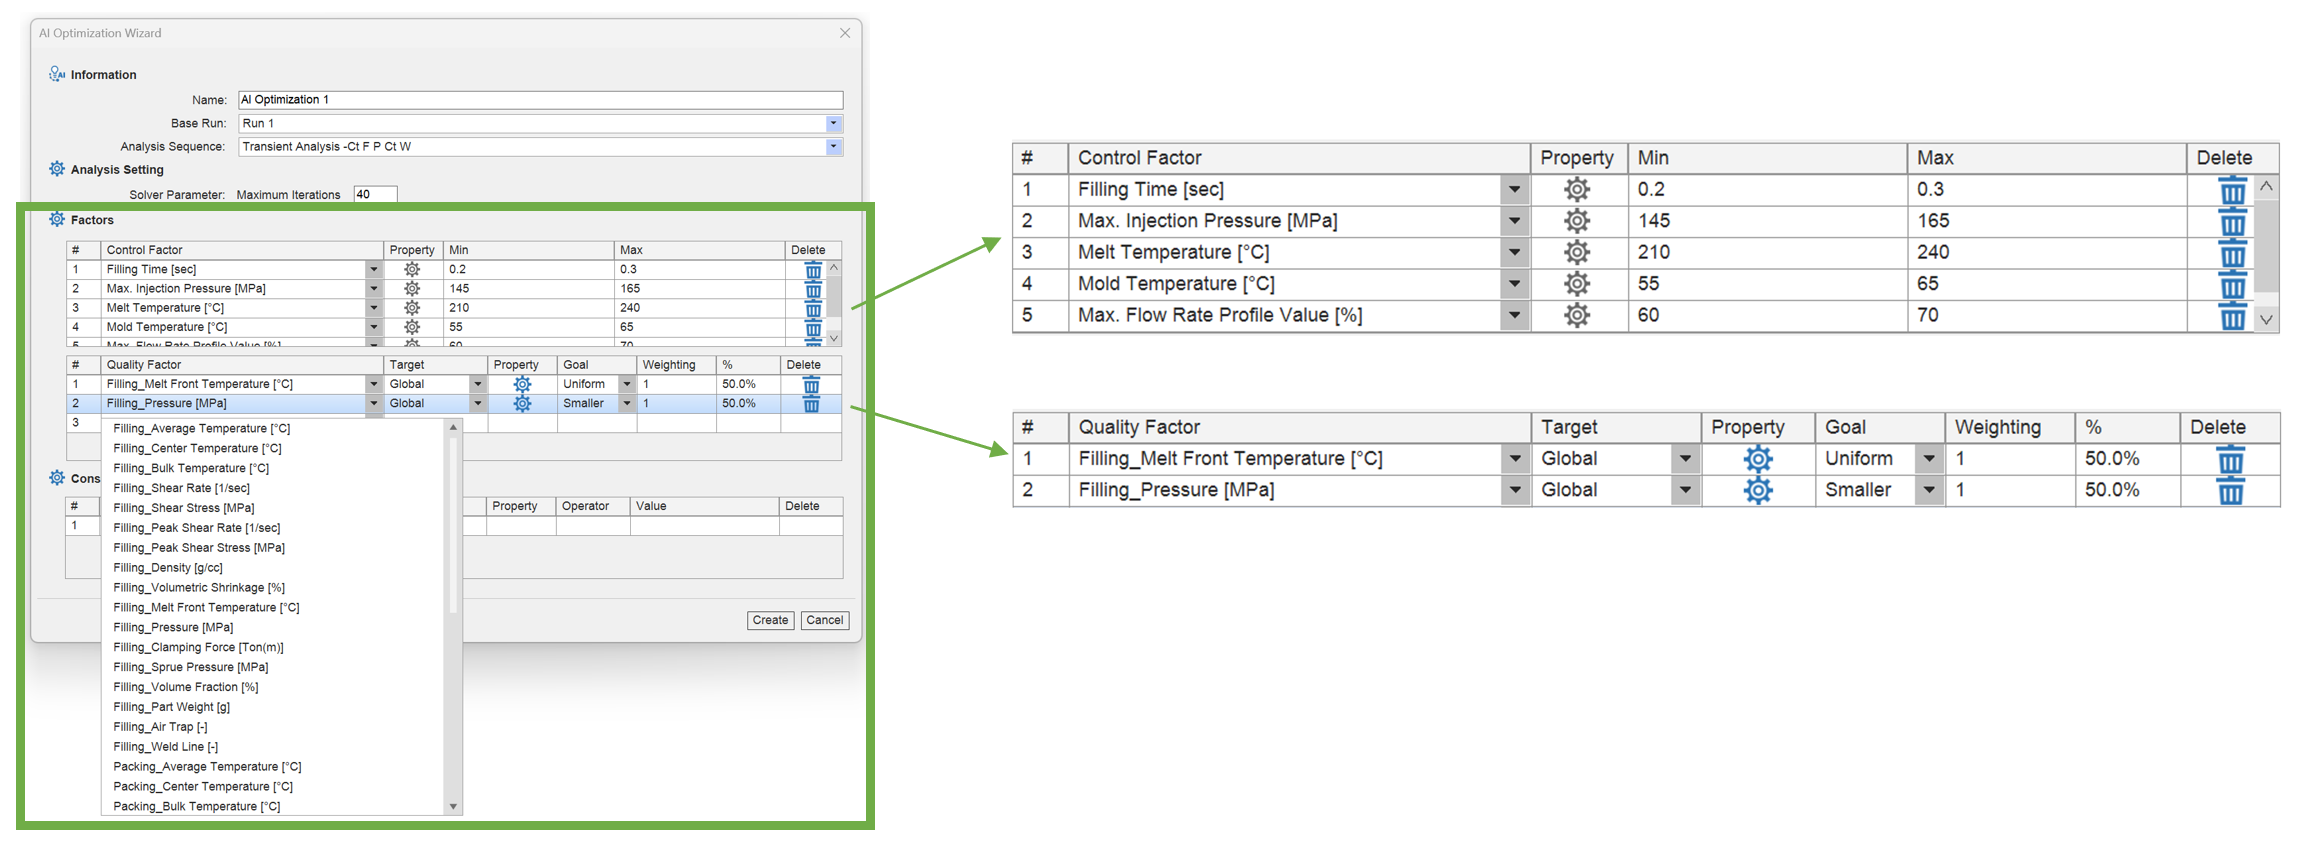
Select control factors from the drop-down menu. Set each factor’s optimization range (maximum and minimum values) based on material properties and product design. Next, select Filling_Melt Front Temperature (Uniform) and Filling_Pressure (Smaller) as quality factors with equal weighting (50% each).
※Advanced Quality Factor Settings
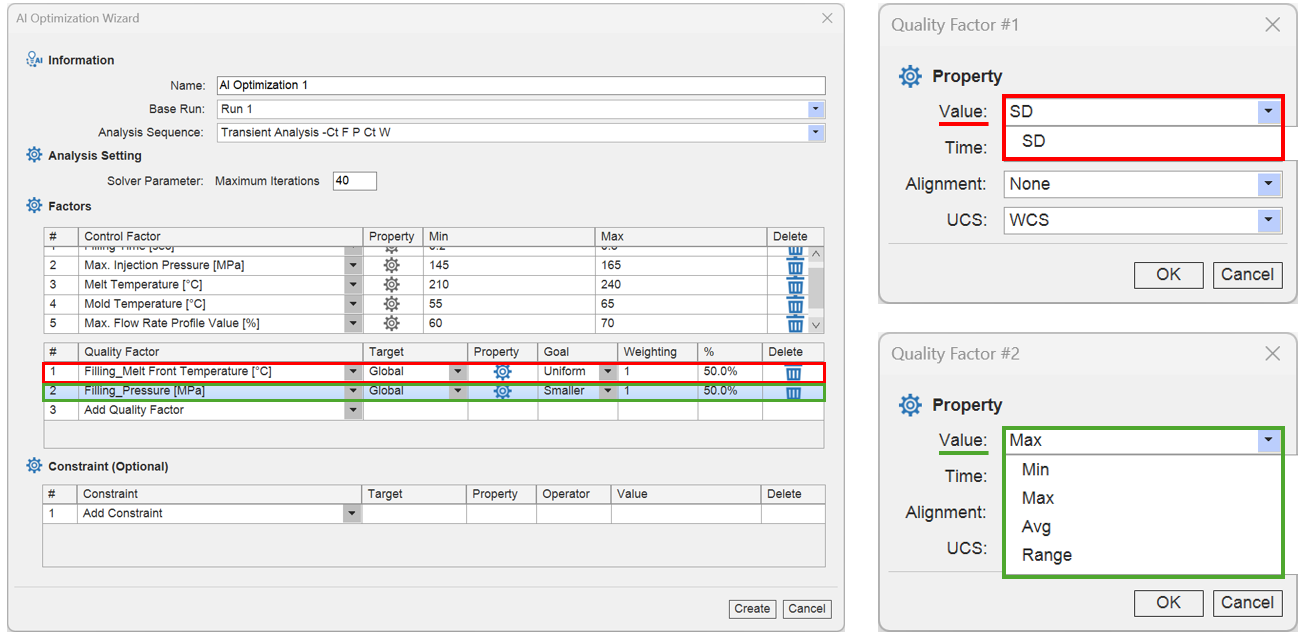
- Click the gear icon to open the Property When the goal is set to larger, smaller, or nominal, specify the desired statistical value, such as maximum, minimum, average, or range. When the goal is set to uniform, the statistical value is fixed to standard deviation (SD).
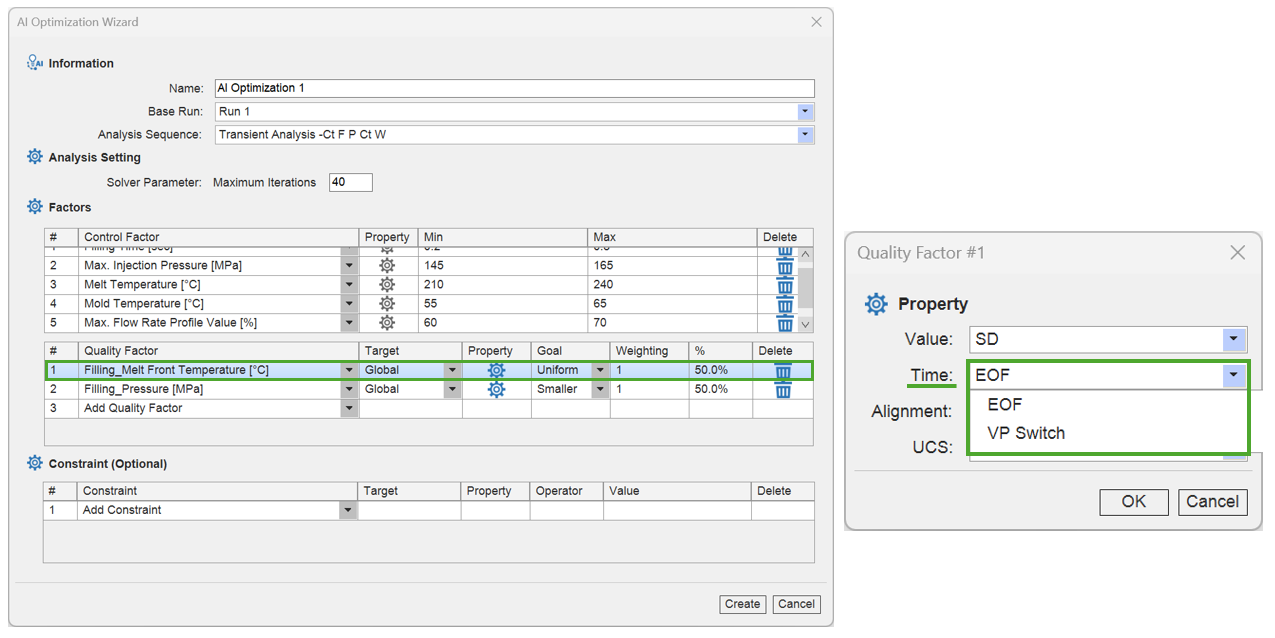
- If the quality factor is a filling result, users can set the experiment time to EOF or V/P switch.
Step 4: Create the Iteration Run and Review Settings
Click Create, and the iteration run will be generated automatically. Users can reopen the wizard from AI Optimization Info and review the settings in view-only mode.
Step 5: Submit the Iteration Run
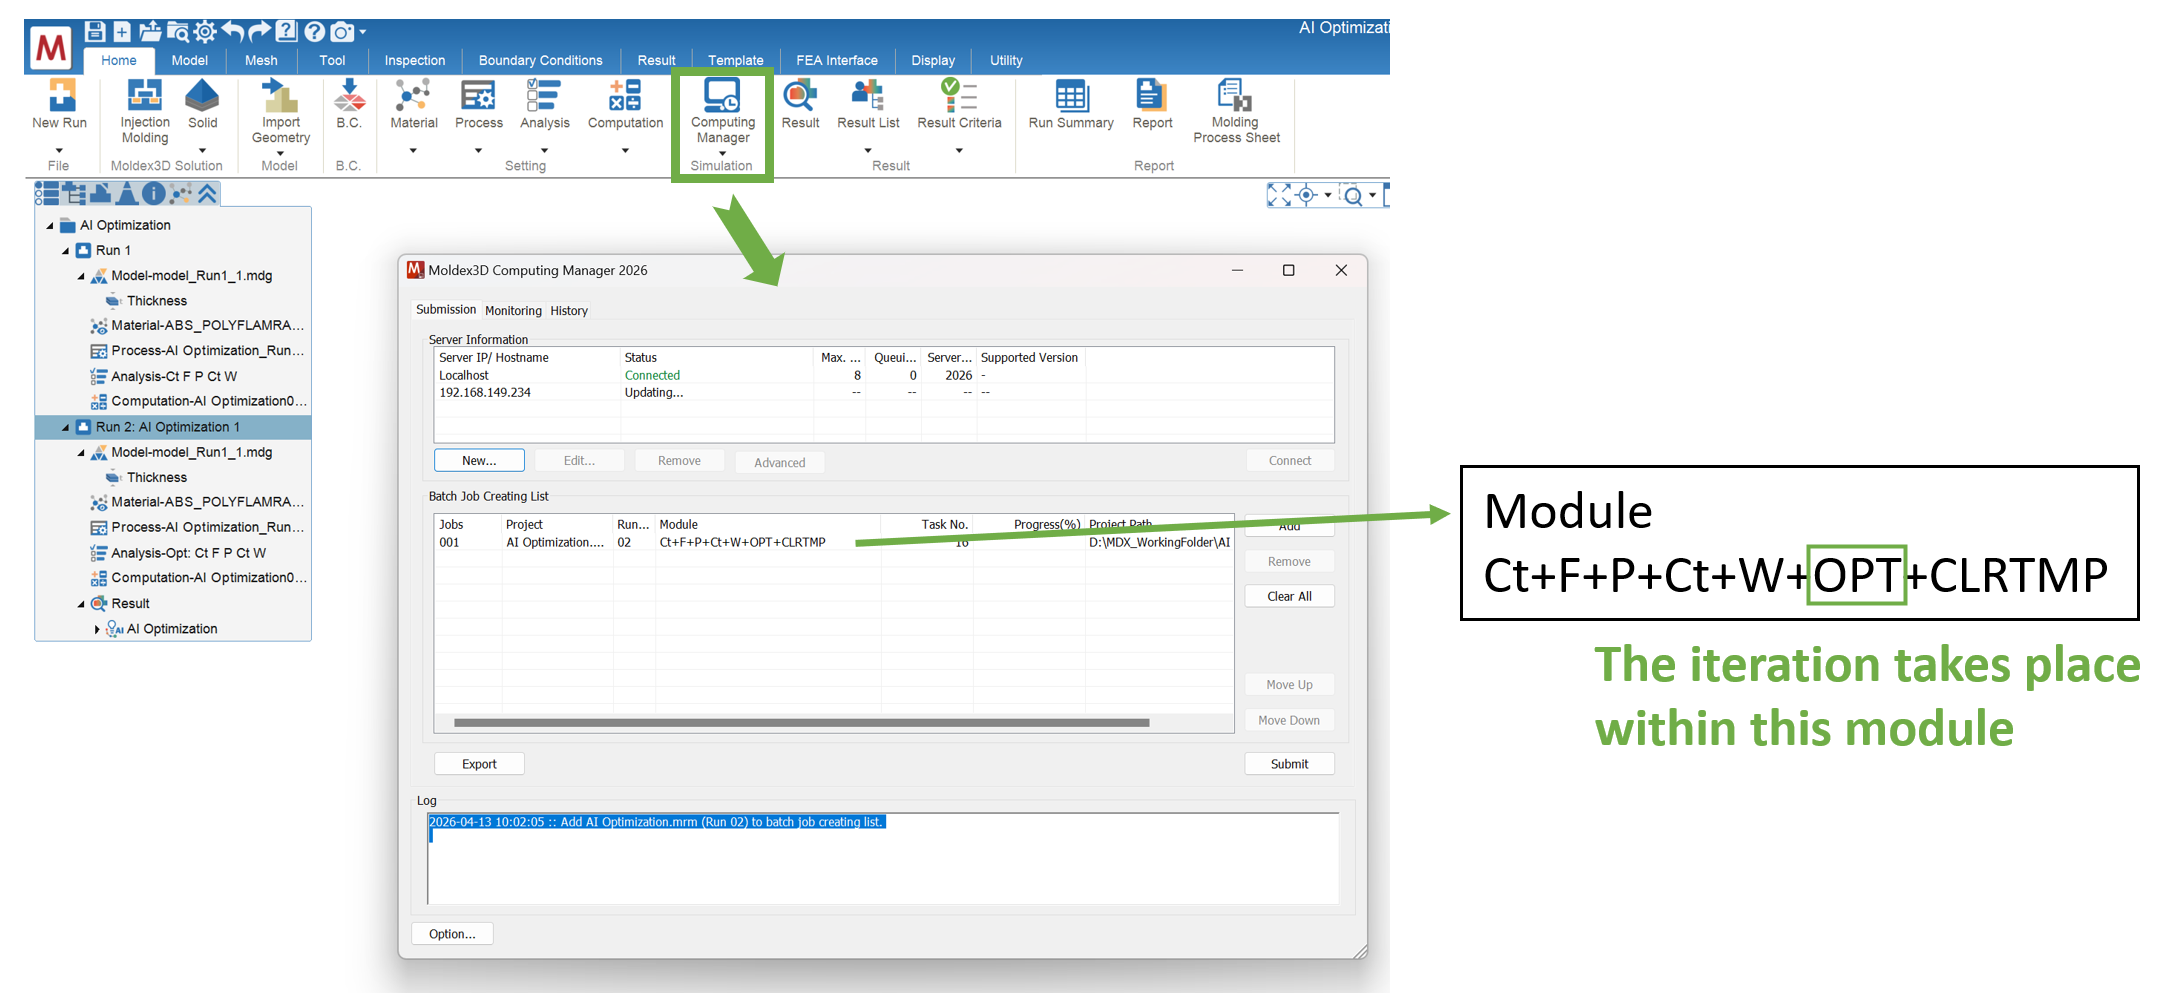
Click Computing Manager to submit the run for analysis. All other settings are automatically configured when the AI optimization run is created. Note: Only Localhost is supported.
View AI Optimization Results
- AI Optimization Info
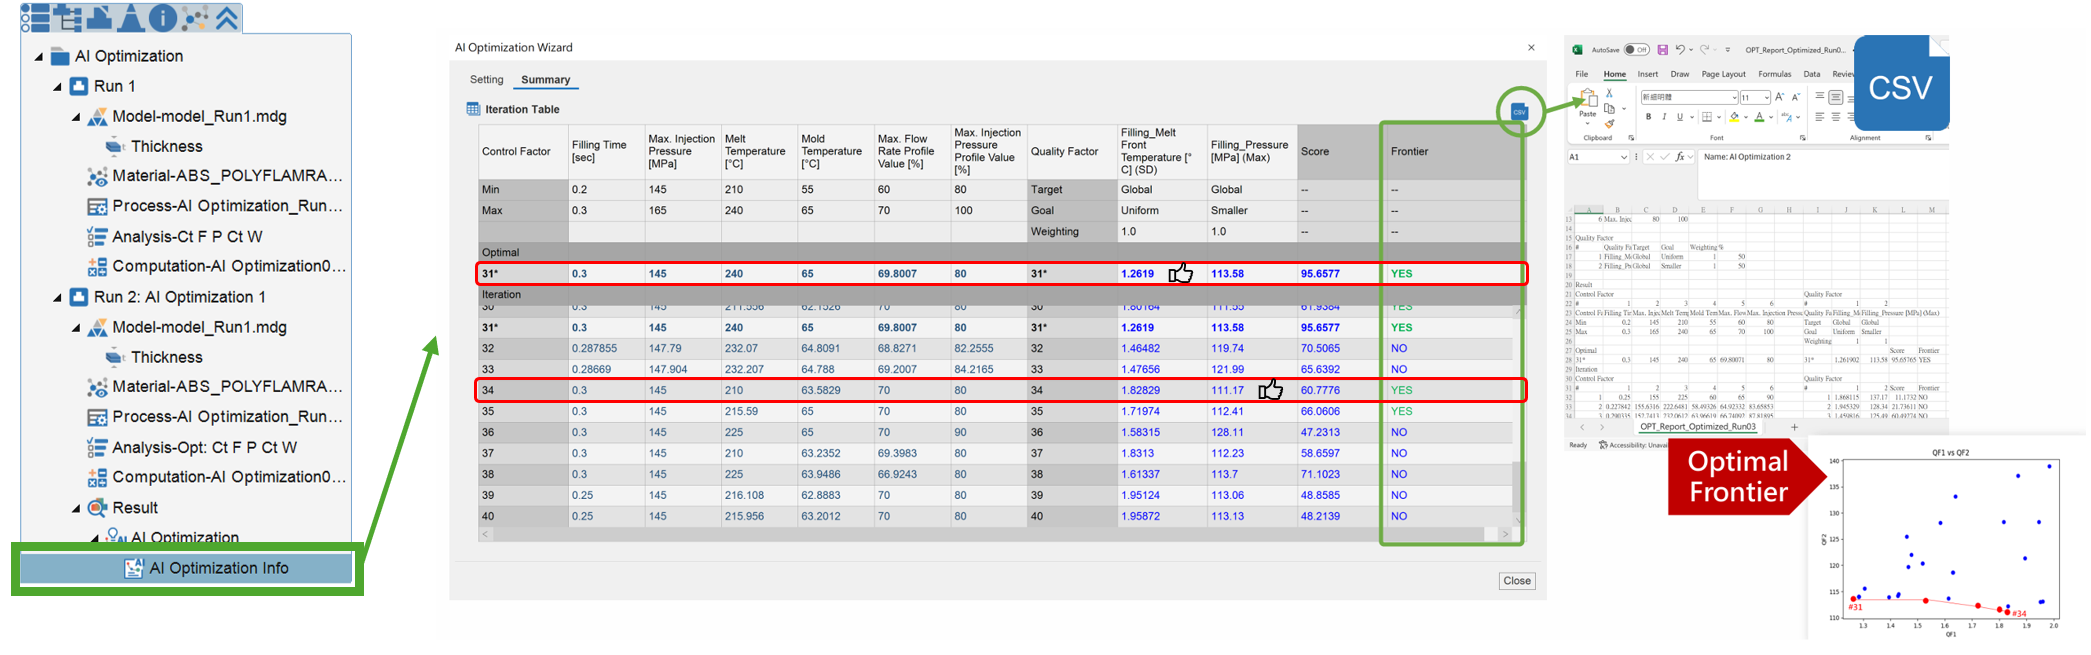
After the analysis, click AI Optimization Info to view the optimal settings and results. The Summary tab shows an overview of the control and quality factors for each iteration. Each iteration represents a candidate solution with its own weighted score, and the one with the highest score is the optimal solution. The system also provides Pareto front solutions for evaluating trade-offs between objectives. For example, iteration 31 has better temperature uniformity, while iteration 34 achieves lower pressure. The data can be exported as a CSV file for further analysis.
- Parallel Coordinates Plot
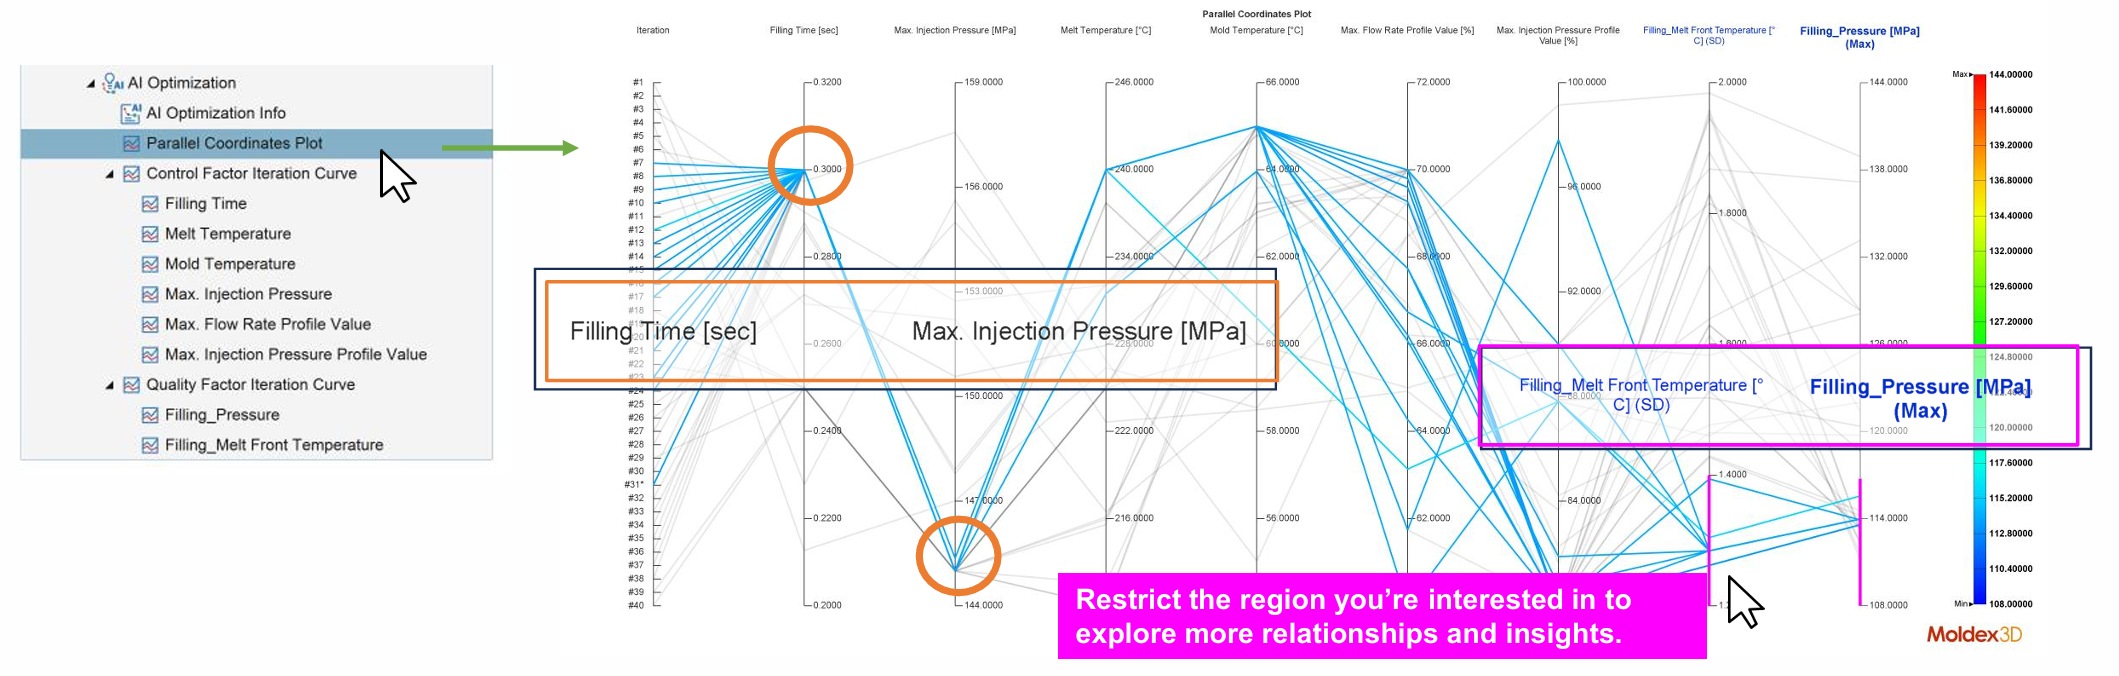
The parallel coordinates plot can be used to explore the relationships among variables. Hovering over a curve selects it and highlights it in red. Users can also drag across the plot to select a range of interest and see how the parameters relate to one another. In the case mentioned above, reducing both the melt front temperature and the maximum filling pressure requires a longer filling time and a lower injection pressure.
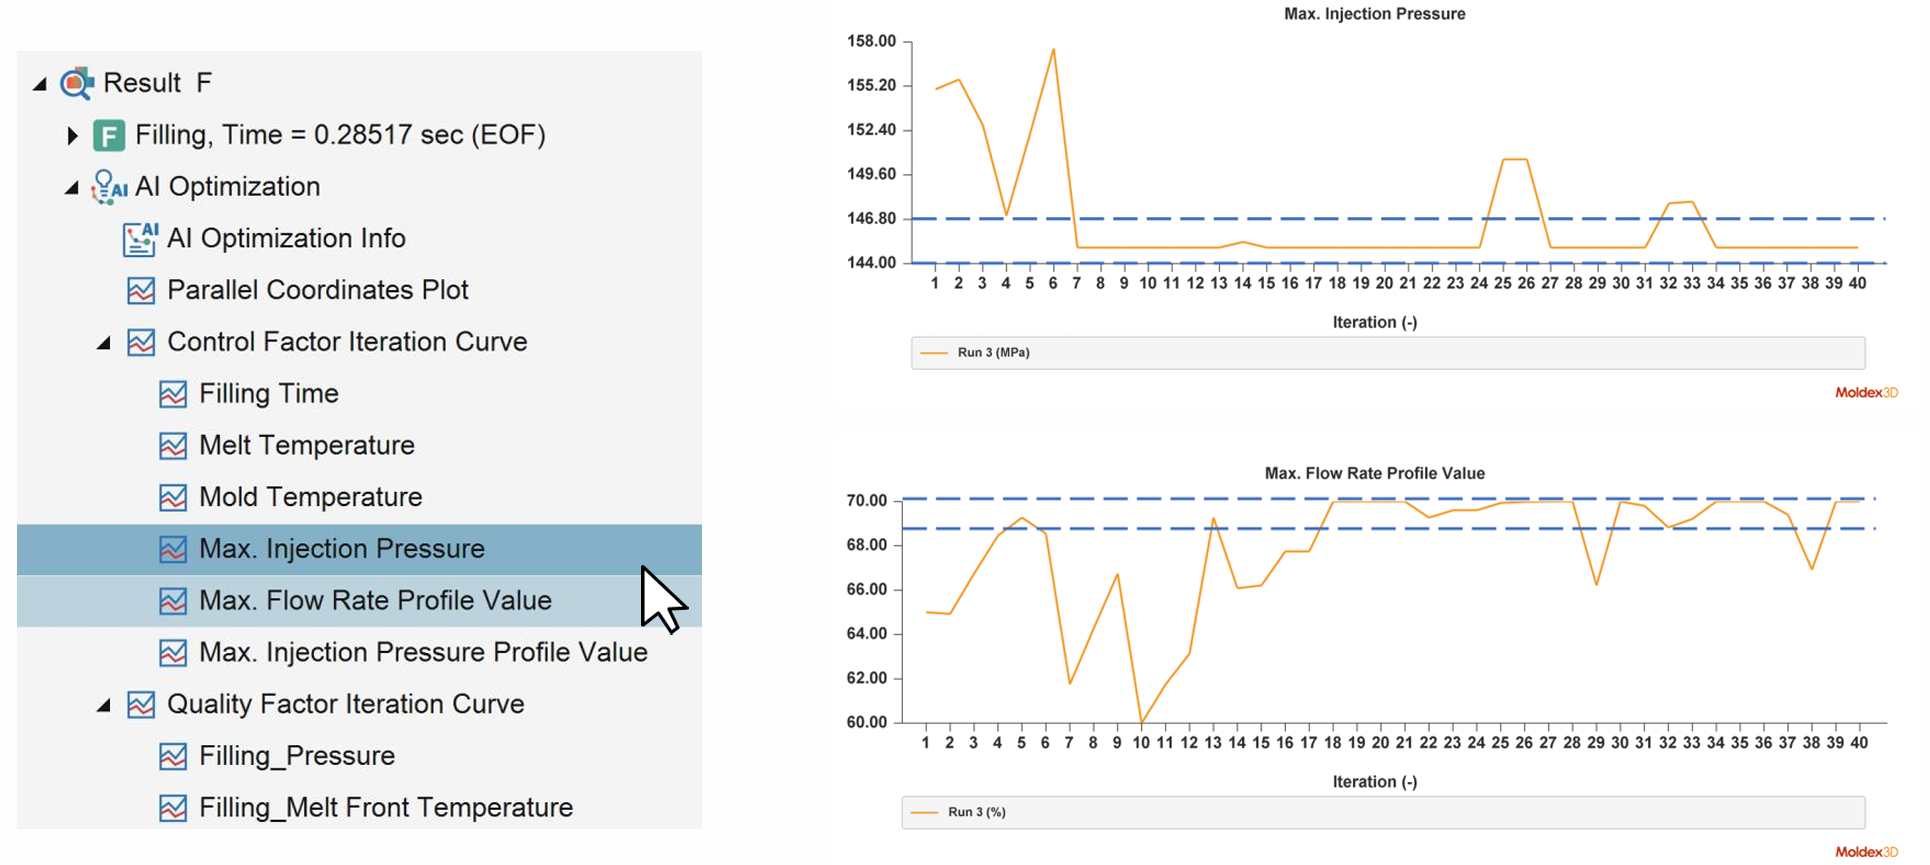
- Control Factor Iteration Curve
The iteration curves show how the control factors converge by plotting each control factor’s value against the number of iterations. As the optimization progresses, the search range gradually narrows and may stabilize within a specific range of values. This indicates that the system has converged to an effective control range.