Moldex3D R13 introduced new visualization approach for tracking the filling behavior of each charge. This enhancement provides users with a more accurate picture of the filling pattern and the charge volume. This will help determine a proper charge size and charge location to further avoid potential manufacturing issues. The following steps describe how to visualize the filling behavior of each charge in Moldex3D Compression Molding analysis and how to interpret the simulation result.
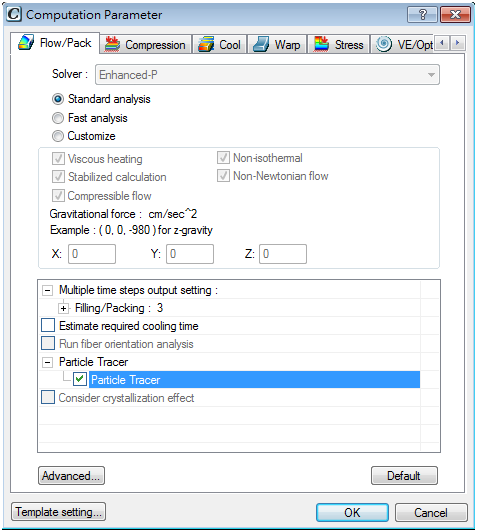
Step 1. Open the computation parameter dialog and check Particle Tracer at the Fill/Pack stage.
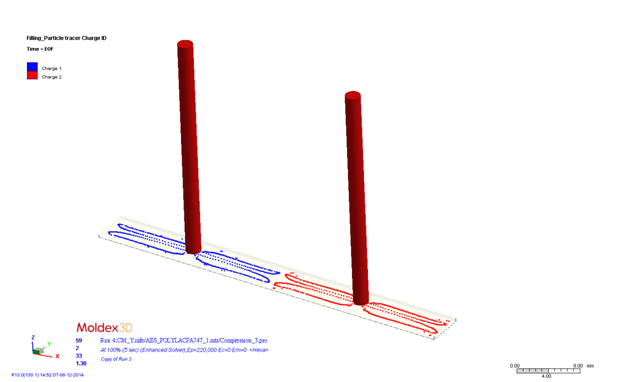
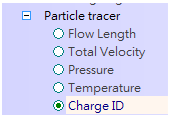
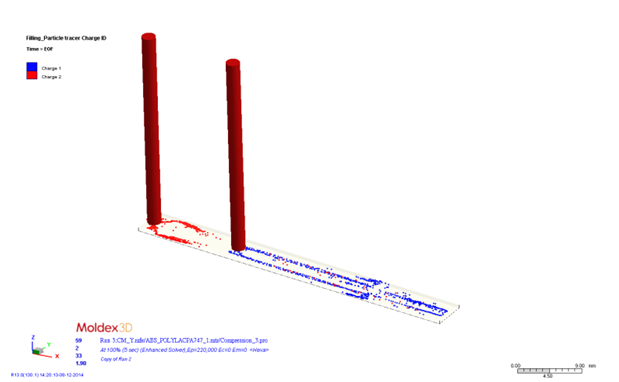
Step 2. After the Fill/Pack analysis, particle tracer results will be available. Choose points or lines to display the results. Select Charge ID in the filling analysis result to display particle tracer distribution.
Particle Tracer Analysis Results
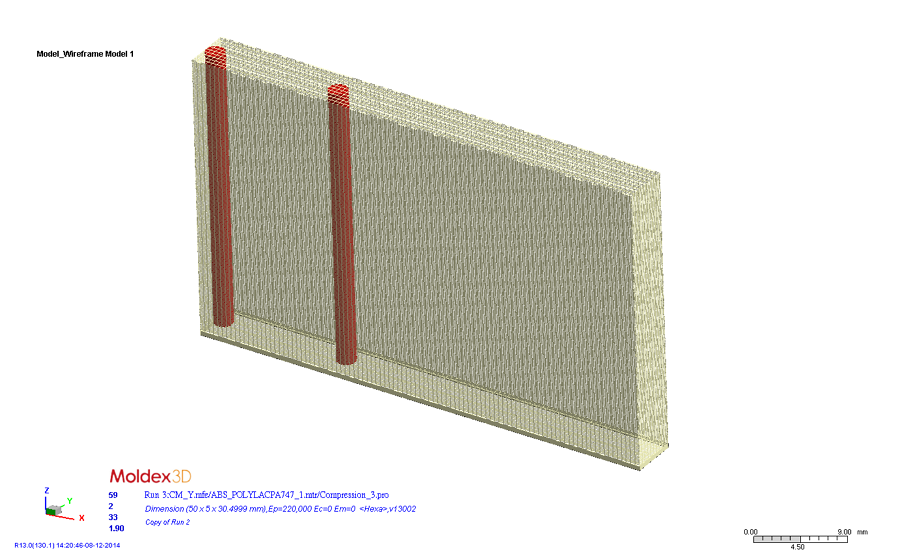
1. The geometry with two charges and one compression zone is shown in the following figure.
2. Select Charge ID in the Fill/Pack analysis result. The particle distribution of the different charges will be displayed. In the figure below, two different charges are represented by different colors. Based on the simulation analysis result, the flow will be unbalanced. Therefore, better charge locations are required.
3. The simulation analysis of particle distribution is performed again to verify the optimized charge locations. As shown below, the flow balance has been greatly improved. It will also lead to better pressure distribution.