
By Jay Vang
Copyright MoldMaking Technology 2019. Reprinted with permission from Gardner Business Media.
Today there are still conformal cooling skeptics, and because of incomplete analysis, they should be. Simulation is a great validation tool, but that is all it is. It is a powerful tool, but results are still based on the input of the users. Of course, there are optimization tools and modules within the software, but the saying “garbage in garbage out” applies. Two analysts running a plastic injection simulation can give totally different results if the inputs are different. For conformal cooling, specifically, wrong assumptions and dismissing important factors such as the ability to achieve the necessary flow rate to ensure turbulent flow can result in a bad investment.
Simulation v. s. Analysis
Conformal cooling can help minimize cycle time and achieve dimensional tolerances. However, it will only work as well as the simulation if the designer can maintain the necessary flow rate through the conformal cooling circuit. A designer running a heat sink simulation (cooling channel defined only as a heat sink source) on complex designs will not tell the full story of what may occur in the mold. Let’s look at some results in Fig. 1, which are from a computational fluid dynamics (CFD) analysis showing Reynolds number at a flow rate of approximately 2.0 gpm.
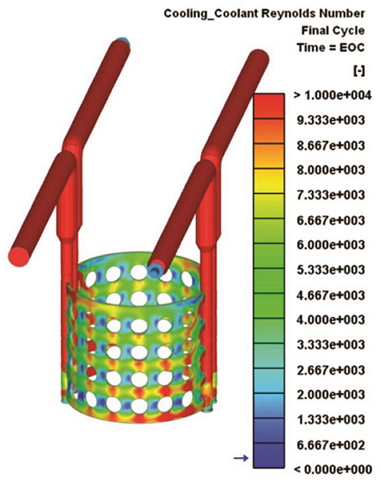
Fig. 1 Results from a computational fluid dynamics (CFD) analysis showing Reynolds number at a flow rate of approximately 2.0 gpm.
Some regions show a Reynolds number above 4200, indicating turbulent flow while other regions show a Reynolds number below 4200, indicating that the flow in certain regions may not be turbulent necessarily. This variation will vary cooling efficiency throughout the circuit. Velocity has a direct correlation to the Reynolds number, so if a designer identifies the low/no flow regions he or she can optimize the cooling channel design. Simulation can also display velocity results that indicate low/no flow regions that are doing less work and potentially stagnant areas. Keep in mind that fluids take the path of least resistance, so instead of taking random paths and flowing around all of the holes, the coolant will flow straight from the inlet side to the outlet side.
Designers can use such data to optimize the design to minimize low/no flow regions (shown in dark blue between the holes Fig. 1). For example, designers can try to offset the holes to divert the water through the regions with a low Reynolds number, which indicates low/no flow regions. Despite a designer offsetting the holes, a path of least resistance may remain. However, offsetting the holes can still help to minimize the no/low flow regions, maximizing turbulent flow throughout with an achievable flow rate.
The question now is “How much will the results of a heat sink analysis differ from these?” Not much from a cooling calculation standpoint and depending on flow rate input. However, heat sink analysis along with CFD analysis can determine effectiveness and amount of change.
Heat sink analysis alone also does not work well for conformal cooling channel analysis because conformal cooling typically consists of small-diameter circuits with long flow lengths that conform to the geometry of the parts (see Fig. 2 and 3). The small diameter or thickness of the design and longer flow length circuits require higher pressures to effectively push sufficient flow rate through the circuit.
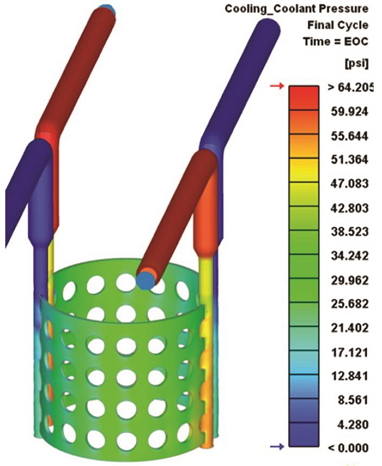
Fig. 2 Coolant pressure results from the same model at the same flow rate of 2.0 gpm.
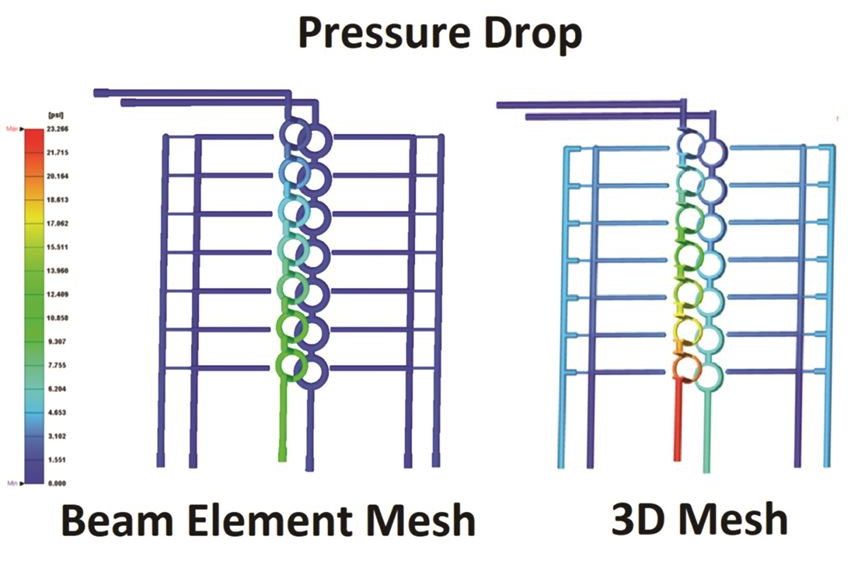
Fig. 3 A comparison of pressure drop results between beam element and 3D mesh simulation methods. Pressure drop results indicate the head pressure required to push the indicated flow rate through the cooling circuits.
Pressure Requirements
If Reynolds number and velocity are dependent on flow rate, identifying the pressure required to achieve a certain flow rate is essential to determine whether or not achieving the required flow rate is realistic. Fig. 2 shows coolant pressure results from the same model at the same flow rate of 2.0 gpm.
A designer must understand pressure requirements and the minimum flow rate to achieve turbulent flow in the design where they intend to have good heat transfer, because fluids take the path of least resistance. Fig. 1 indicates that water flows in areas where the Reynolds number is between 4,000 and 10,000+ and that turbulent flow (Re # > 4200) is likely present in most regions. However, high pressure is required to achieve 2.0 gpm flow through the circuits to achieve these values.
Thermolators on the market today can generate up to approximately 100 PSI, but 65 PSI might not be achievable because fluids prefer the path of least resistance or areas with less resistant circuits such as manifold plates and core and cavity plates. If the flow rate falls below 2.0 gpm, the Reynolds number will decrease, potentially yielding laminar flow through the circuit, which is not efficient. Also, a designer simply increasing the flow rate to the manifold will not result in a linear distribution of fluid through all circuits.
Simulated results and actual results may differ if a designer does not hook up the conformal cooling circuits to their own thermolator or if they don’t use flow restrictors to divert water to specific lines. If the designer cannot achieve the necessary flow rate to maintain turbulent flow through a conformal cooling circuit, they can drill conventional circuits and achieve equivalent or better results.
Meshing Matters
A designer can achieve more accurate and reliable analysis of conformal cooling designs with accurate CFD analysis. However, not all CFDs are the same. The two main meshing methods for cooling channels in injection simulation software are beam elements and 3D elements.
Beam elements can determine the Reynolds number, temperature rise/fall throughout the mold, and flow distribution, but they are not nearly as accurate as 3D mesh elements when predicting pressure drop. Beam elements also have a hard time capturing true complex geometries and require modeling as relative volume. However, beam elements do yield faster simulation times compared to
Fig. 3 compares pressure drop results between beam element and 3D mesh simulation methods. Pressure drop results indicate the head pressure required to push the indicated flow rate through the cooling circuits. Although the pressure requirement ratio from one circuit to another is similar, the beam element indicates 25 to 50 percent less pressure required for the complex circuits and the potential to exacerbate the pressure with a complex conformal cooling design. Pressure drop results alone can lead to false thermolator requirements, which will yield insufficient flow through circuits that are more restrictive. For example, conformal cooling circuits that create an ineffective conformal cooling design.
Proving It Out
To determine if 3D mesh elements capture more precise pressure drop prediction than beam elements, Kevin Klotz from MGS Mfg. Group conducted a test to validate pressure predictions (see Fig. 4).
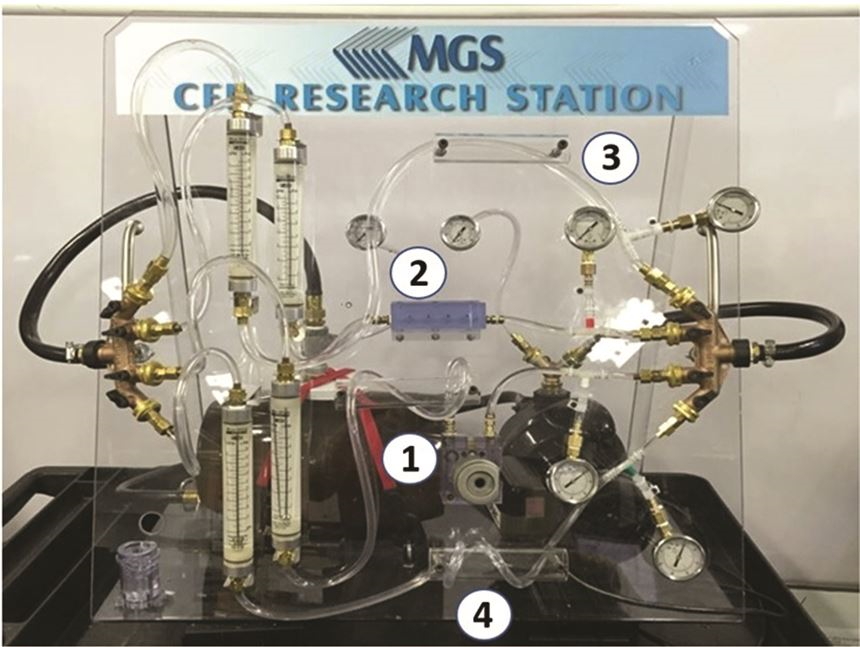
Fig. 4 MGS Mfg. Group used this testing equipment to validate pressure indications: (1) a DMLS-conformal-cooled insert, (2) a 3D-printed set of bubblers, (3-4) clear tubing with different length and diameters, pressure gauges and flow gauges connected to a water transfer pump and a water tank.
Klotz used one DMLS-conformal-cooled insert, a 3D-printed set of bubblers, clear tubing with different length and diameters, pressure gauges, and flow gauges connected to a water transfer pump and a water tank. The apparatus was modeled in CREO and recorded to compare with simulation. The same model was sent to Dr. Jeet Sengupta of Hoerbiger Corporation of America to run a CFD analysis via ANSYS CFX and to Moldex3D to simulate using their 3D boundary layer meshing (BLM).”
Both software tools use the recorded flow rate values through each circuit and the combined flow rate value of 6.5 gpm as the input from the pump to record pressures at the inlet, exit, and pressure gauge locations. Fig. 5 shows results from CFD analysis and 3D BLM to mesh the model. Using the latter the designer modeled the inlet and outlet hoses straight instead of curved, as the software requires inlets and outlets of fluid source to be perpendicular to the mold face.
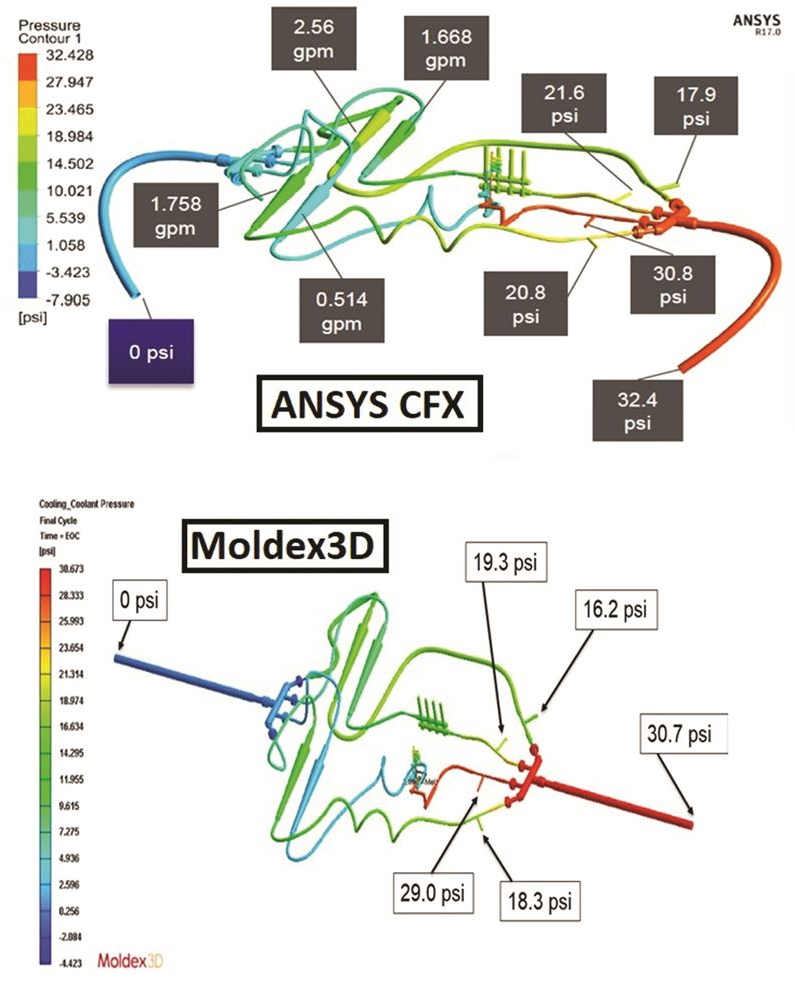
Fig. 5 Results from a CFD analysis and 3D BLM to mesh the model. Using the latter, the designer modeled the inlet and outlet hoses straight instead of curved, as the software requires inlets and outlets of fluid source to be perpendicular to the mold face.
Pressure results from both software tools are very close to the recorded values from the physical apparatus. Table 1 compares the recorded values to the simulated pressures. For example, the largest difference from CFD analysis to recorded values is about 5.0 psi and 2.5 psi using BLM mesh. Both results are well within acceptable accuracy for the intended purpose, considering the tolerance in pressure gauge reading and flow rate measurements from an inline flow gauge.
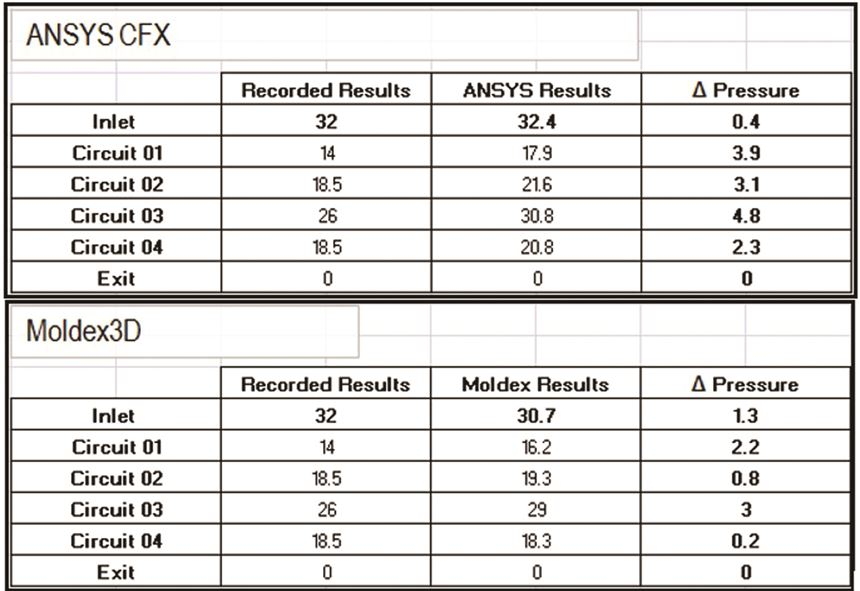
Table 1 Comparison of the recorded values to the simulated pressures.
Lessons Learned
Conformal cooling can work as intended if it is properly designed, which requires a thorough simulation using CFD analysis to understand the characteristics of the fluid flow. For example, if a 3D-printed insert branches into two or more channels, determining the favored branch can make a large impact on conformal cooling design effectiveness.
If a designer only runs a heat sink analysis, he or she will not capture the difference or predict the pressure required to achieve a flow rate for turbulent flow for complex cooling designs like conformal cooling. However, a designer can precisely capture fluid flow characteristics using 3D mesh elements. 3D mesh elements capture fluid flow characteristics, such as momentum change, for accurate pressure predictions.
 |
Jay Vang
|