


- Customer: The Ohio State University
- Country: U.S.A
- Industry: Educational/Academy
- Solution: Moldex3D Advanced / Optics Module
- View PDF Version
Executive Summary
Microinjection molding is a mass-production method to fabricate affordable optical components. However, it often results in part deformation and uneven refractive index distribution. Finite Element Method (FEM) was employed to understand the influences of injection molding on the optical performance of freeform Alvarez lenses. The optical wavefront patterns were evaluated using an interferometer-based wavefront measurement system. This setup utilized an optical matching liquid to reduce or eliminate the lenses’ surface power such that the wavefront pattern with large deviation can be measured by a regular wavefront setup. Moldex3D was also applied to help understand how the potential issues, surface deformation and refractive index variation, can influence the wavefront change.
Challenges
- Quality issues for optical applications: thermally-induced shrinkage, non-uniform refractive index, and birefringence
- How to use FEM to model the molding process
- How to analyze process’ influences on optical performance of injection molded freeform optics
- How to fundamentally verify simulated optical performance
Solutions
Moldex3D provides two most critical, accurate simulated parameters: part warpage and refractive index for freeform optics. It provides true 3D results with consideration of filling, packing, and cooling stages too.
Benefits
- Improve understanding of the quality control of microinjection molded freeform optics
- Visualize and obtain the value of geometry deformation and refractive index variation
- Learn how the surface deformation and refractive index variation affect the wavefront change
Case Study
The objectives of this study are to compute geometry deformation and refractive index variation from FEM model of the freeform optical element, to measure the wavefront pattern which indicates the optical performance of the microinjection molded lens, and to compare the simulation with the measurement results that will give better understanding for optimization of the optical performance via CAE approaches.
Moldex3D simulation was performed using a 3D FEM model, created using HyperMesh beforehand, in order to obtain the results of part deformation and refractive index distribution (Fig. 1). The material used in the simulation was PMMA Plexiglas V825. The software can detect and show the surface deformation of this freeform optics and the uneven distribution of the part refractive index (Fig. 2). Then, these results were verified and compared with the measured ones by which the aberrations could be calculated.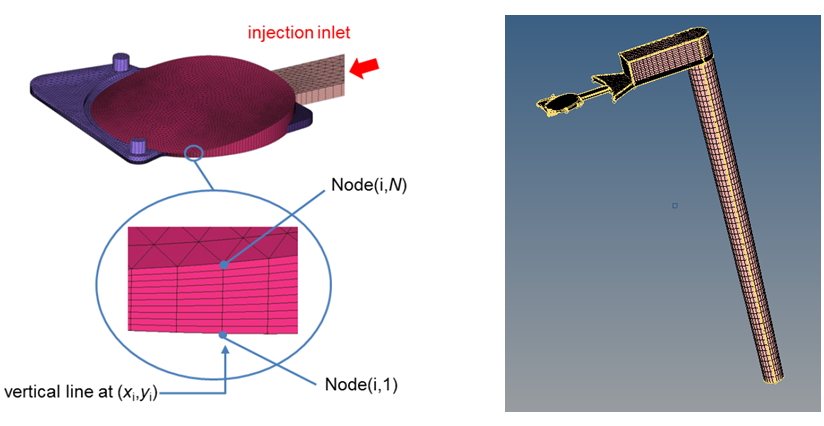 Fig. 1 The 3D meshed model is made of 10-layer prism elements (left) with a runner system shown on the right.
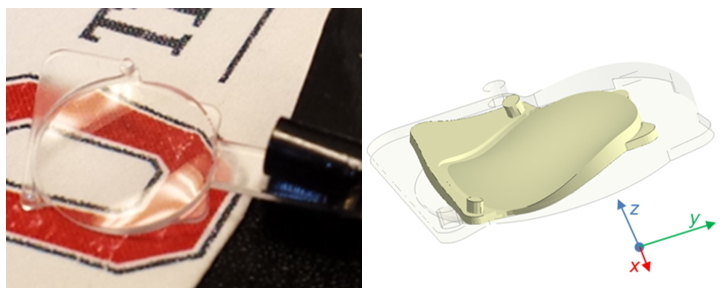 Fig. 2 The microinjection molded Alvarez lens (left) and the visualization of its surface deformation (right).
There was no change made to the original design since the main purpose of this study is to verify the simulation results by the measured ones (Fig. 3 & Fig. 4). Any changes to optimize the injection molding process are planned to be part of the future tests of this study.
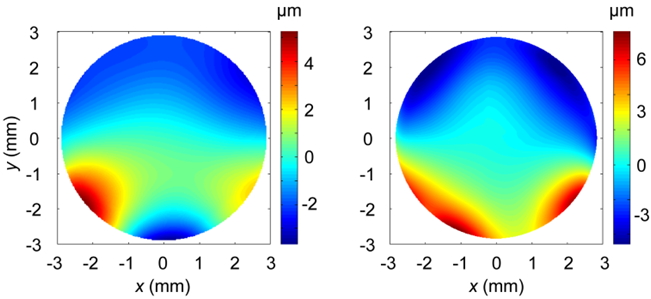 Fig. 3 The simulated (left) and measured (right) surface deformation of the microinjection molded Alvarez lens.
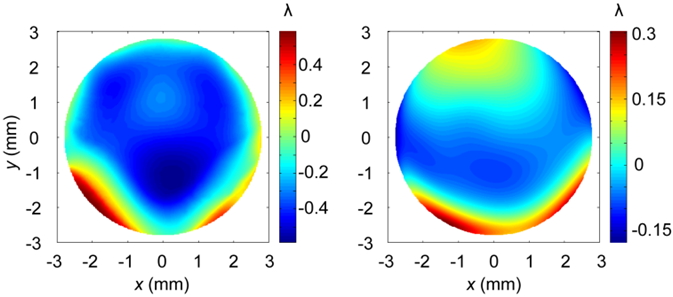 Fig. 4 The simulated (left) and measured (right) refractive index distribution of the microinjection molded Alvarez lens.
Furthermore, the wavefront patterns of this freeform lens were also verified. The verification compared the nominal wavefront pattern of an undeformed Alvarez lens which had uniform refractive index with the measured wavefront pattern of the microinjection molded Alvarez lens. The measurement setup utilized a transmission interferometry setup. The lens was immersed in an optical liquid with controlled refractive index. If the controlled refractive index of the optical liquid matches to the nominal surface refractive index of the lens material, the measured wavefront pattern indicates the refractive index variation inside the lens. On the other hand, if the controlled refractive index is not equal to the nominal refractive index of the lens material, the measured wavefront pattern is primarily determined by the surface power.
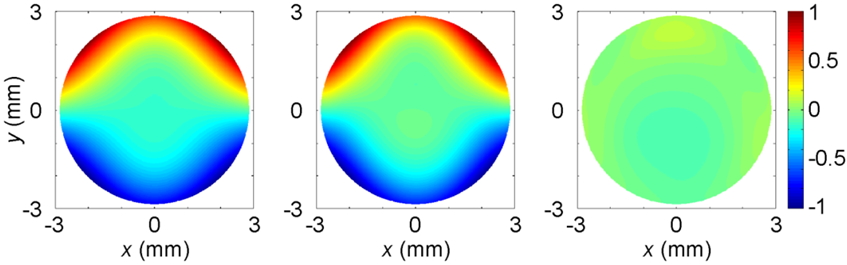 Fig. 5 The nominal wavefront (left) and the measured wavefront (middle) are compared to show their difference (right).
The results show that the nominal wavefront deviation is 15.89 λ, while the measured one is 15.8 λ. The maximum local difference of these two wavefront patterns is less than 5%, and the major differences come from the center and corner areas. Indeed, the cause of this difference is the combined effect of both surface deformation and refractive index variation occurring in the actual microinjection molded part, once predicted by Moldex3D software beforehand as well.
Results
Through Moldex3D analysis, both part warpage and refractive index of the microinjection molded freeform optics could be accurately obtained and visualized. This helps to give better understanding of how the potential issues, such as surface deformation and refractive index variation, can influence the wavefront change. The difference between nominal wavefront pattern of undeformed Alvarez lens with uniform refractive index and the measured one of microinjection molded Alvarez lens, which had deformed shape and non-uniform refractive index, was found out to be primarily determined by the combined effects of those two issues. In addition, true 3D results of filling, packing, and cooling stages are also provided from the simulation. Importantly, the use of this software also helps to significantly reduce the product development cycle time. Last but not least, Moldex3D provides an opportunity to conduct several future tests for this study, such as stress and birefringence analyses, insert molding for integrated optics, and optimization for the injection molding process using the DOE feature that will reduce the wavefront difference.