
Multi-cavity co-injection molding is one of the most commonly used processes to manufacture automotive components and structural reinforcement products, and it has been widely applied in many industries. The benefits of multi-cavity co-injection molding include the ability to reduce material waste and cost, and further enhance the productivity of co-injection molding parts.
However, the same general guidelines for developing a single-cavity co-injection mold cannot be fully applied in the development of a multi-cavity co-injection mold. The key to a successful multi-cavity co-injection mold is proper core/skin distribution. The co-injection molding is already a complex process itself. By combining multi-cavity molding process, which often results in flow imbalance, it would be very difficult to achieve the desired distribution of materials.
Moldex3D, a computer-aided engineering tool, is often used to predict potential molding issues and analyze the intricate mechanism of multi-cavity co-injection molding system. The following case study illustrates how Moldex3D is used to evaluate the effects of injection flow rate and cavity design for designing a better multi-cavity co-injection mold.
The runner geometries and the cavity used in this multi-cavity co-injection simulation experiment are shown in Fig. 1. The material of the core and skin is POLYREX®PG-22. In the molding process, a certain percentage of skin is injected first, and then the core material is injected to finish the filling process. The skin to core ratio is 72:28.
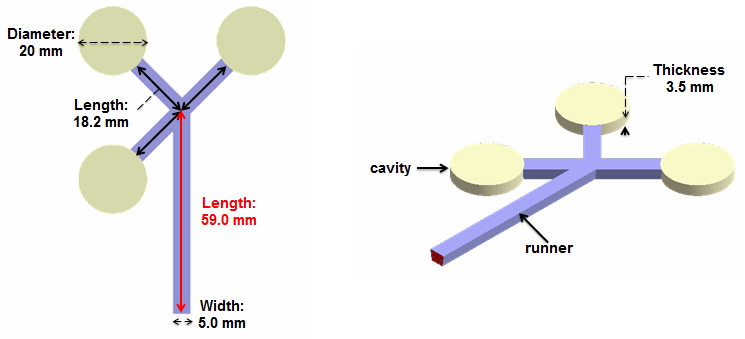
Fig. 1 The cavity and the runner geometries used in the multi-cavity co-injection molding experiment
The comparison of the simulation and experimental results of the core layer melt front is shown in Fig. 2 according to the study. As shown, at a low injection flow rate (10.2 cm3/S), Branch 1 has the longest core penetration distance, while at a higher injection flow rate (51 cm3/s), Branch 2 is the longest. Both simulation and experimental results show similar trends.
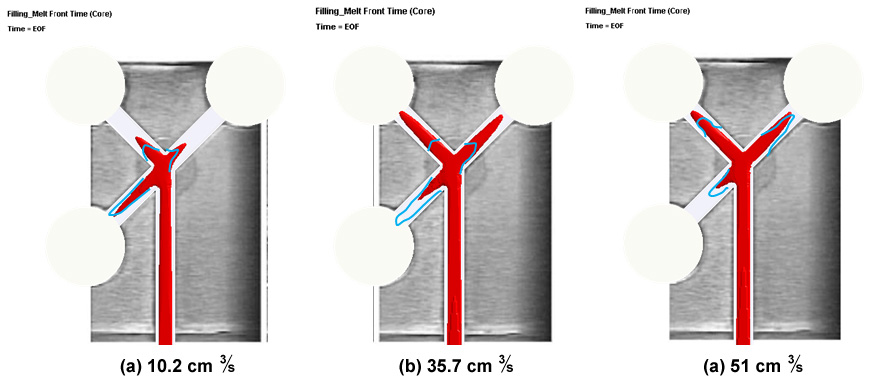
Fig. 2 The blue lines show the melt front result measured in the experiments, and the colored red area is the melt front simulation result.
The following experiment was designed to further investigate the effects of different injection flow rates on the low-viscosity core material penetration. As shown in the analysis results, when the injection flow rate is at 10 cm3/S, the core material in Branch 1 reaches the cavity first. When the injection flow rate increases to 16 cm3/S, the core material in Branch 2 reaches the cavity first. Moreover, as the injection flow rate further increases, the proportion of the core material in Branch 1 decreases. The reason is that more core materials flow into the second and third cavities due to the high shear stress.
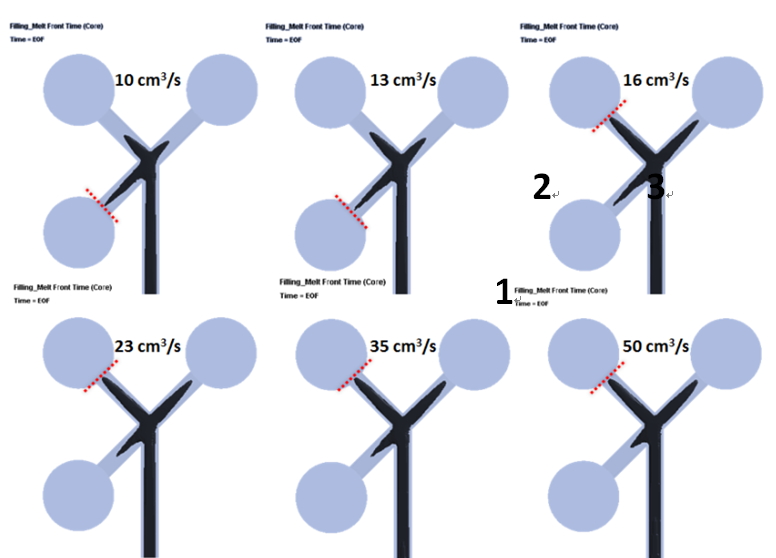
Fig. 3 Simulation results of different injection flow rates
However, the core material penetration simulation results cannot guarantee ideal skin/core distribution can be achieved in the final molded part. Fig. 4 shows unbalanced skin/core distribution in each cavity, regardless of high or low flow rate, since the first cavity has been filled at the earlier stage.
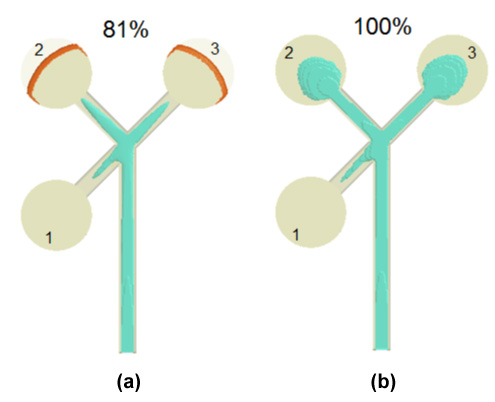
Fig. 4 The melt front simulation results of core material: (a) 81% filling; (b) 100% filling
Thus, in order to efficiently manage the skin/core distribution of the final molded part, it is necessary to take the effects of mold design into consideration. As shown in Fig. 5, if we modify the angles of the runners to a more symmetrical design, we can obtain a more uniform skin/core distribution (Model 2). If the runner design cannot be modified, we can modify the cavity design. Adding an overflow region or adding a connector between each cavity can both improve flow imbalance (as shown in Fig. 3).
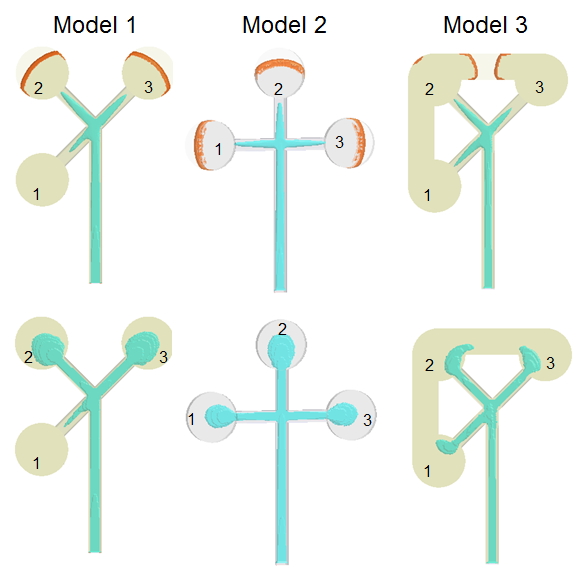
Fig. 5 The influence of different mold design
In summary, the dynamic behavior of core material penetration in multi-cavity co-injection molding is a complicated issue, involving many factors such as flow rate, material properties and mold design. Influenced by the interactions between these factors, it is difficult to achieve a uniform distribution by simply changing the process condition parameters. Therefore, utilizing Moldex3D as a CAE tool has become a much more efficient way to quickly identify and fix potential issues prior to manufacturing and it can also benefit the development of multi-cavity co-injection molding technology.
Reference:
- Wikimedia Commons, Website information: https://commons.wikimedia.org/wiki/File:Co-injection_(sandwich)_molded_part.jpg, Accessed: Nov. 25, 2014.
- Yang, W.M., and Yokoi, H., “Visual analysis of the flow behavior of core material in a fork portion of plastic sandwich injection moulding”, Polymer Testing, 22, pp 37-43 (2003).
- Job, S., “Recycling composites commercially”, Reinforced Plastics, pp, 32-38, Sep/Oct. 2014.
- Pimenta, S., and Pinho, S. T., “Recycling carbon fibre reinforced polymers for structural applications: Technology review and market outlook”, Waste management, 31, pp 378-392 (2011).
- Jackie Yang, Chao-Tsai (CT) Huang, Hsien-Sen Chiu, Jimmy C.Chien, and Anthony Wen-Hsien Yang, “Dynamic Behavior of Core-material Penetration in Multi-Cavity Co-Injection Molding”, SPE ANTEC Tech. Paper, Paper No. 2096345, 1-5 (2015).