
Epoxy Molding Compounds (EMC) are thermosetting plastic materials that are commonly used in the IC encapsulation process. During the filling stage of the encapsulation process, the cross-linking of polymer chains occurs as the temperature increases; when the cross-linking reaction reaches a certain degree, the EMC encapsulates will start to cure, which ultimately leads to better mechanical properties and stability of the finished products. However, in many situations, the EMC melt will not be fully cured when the mold cavity is completely filled. Thus, applying a post-mold cure process is a solution to accelerate the overall curing process. Baking the encapsulated units in a heated oven is one of the commonly used post-mold cure methods; after the units are fully cured, the temperature will be decreased for cooling. During this process, the volume of EMC will shrink due to the effect of cross-linking. In addition, because of the fact that the coefficient of thermal expansion of each element in the encapsulated unit is different, a warpage issue will have a high probability to occur in this process as well. If the warpage problem is too severe, the internal microstructure of the encapsulated unit might be damaged, cracked, or malfunctioned.
To directly address to the above issues, Moldex3D’s post-mold cure analysis provides comprehensive simulation results that allow users to predict potential deformation problems. Moldex3D can provide an accurate prediction of the final warpage analysis by considering the variations in the way warpage changes with temperature and curing degree at the constant pressure during the entire post-mold curing process, meaning from the time the unit is put into the oven to when it is cooled to room temperature. Moldex3D’s post-mold cure analysis will be demonstrated using the following example of a double-layer plate model (Fig. 1, Ref 1):
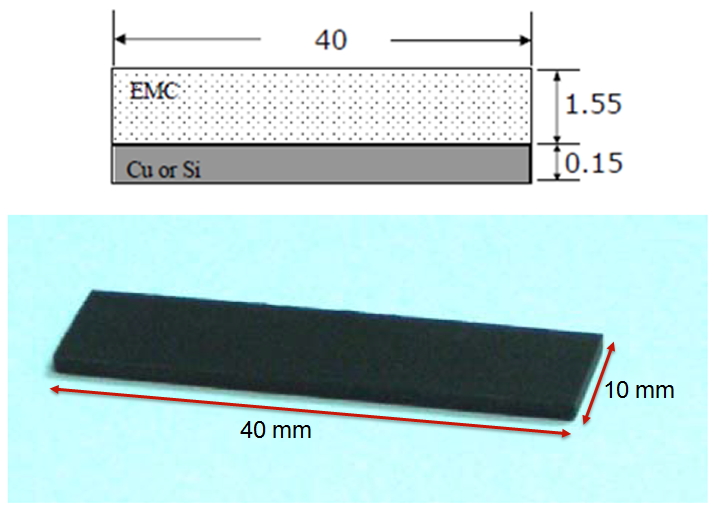 Fig. 1 The geometry of a double-layer plate model; the material used in this case is EMC-Cu.
In this case, an experiment was conducted after the simulation analysis. The ambient temperature setting is shown in Fig. 2 . The result from the experiment showed that the final part warpage in the Z-direction (Z-displacement) is 0.32 mm at the end of post-mold cure process (approximately at the 23000th second). In the simulation analysis result (Fig. 5), the final Z-displacement is 0.354 mm, which is numerically close to the experimental result.
The major influential factor in Moldex3D’s simulation analysis of the part warpage before the part is placed in the oven (Fig. 4), is the volumetric shrinkage caused by raising the curing degree; the Z-displacement from the pre-oven stage is 0.236 mm. After the unit is placed in the oven, the major influential factor of the part warpage becomes the stress relaxation due to viscoelasticity (the encapsulated unit has fully cured at this time as shown in Figure 5). At this stage, the volumetric shrinkage is caused by the release of internal thermal stress solely; the Z-displacement from the oven stage is 0.118 mm. Thus, the final simulated Z-displacement result will be the sum of these two results as 0.354 mm in Figure 3.
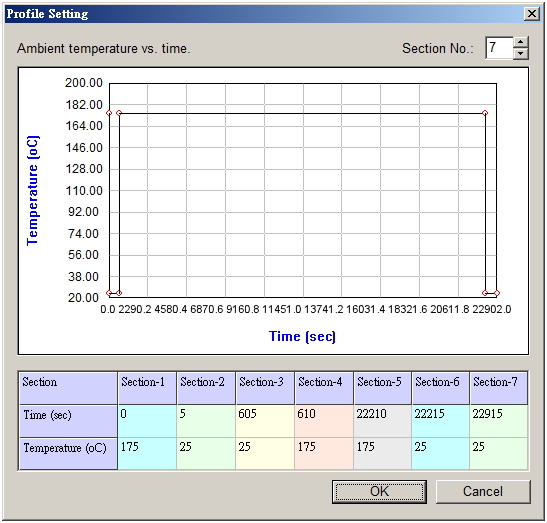 Fig. 2 The image above shows the changes of ambient temperature in the post-mold curing process. The encapsulated unit is at room temperature (25oC) before it is placed in in the oven at an elevated temperature of 175oC, to finalize cross-linking of EMC components. After 6 hours in the oven, the encapsulated unit is then removed from the oven to cool at room temperature.
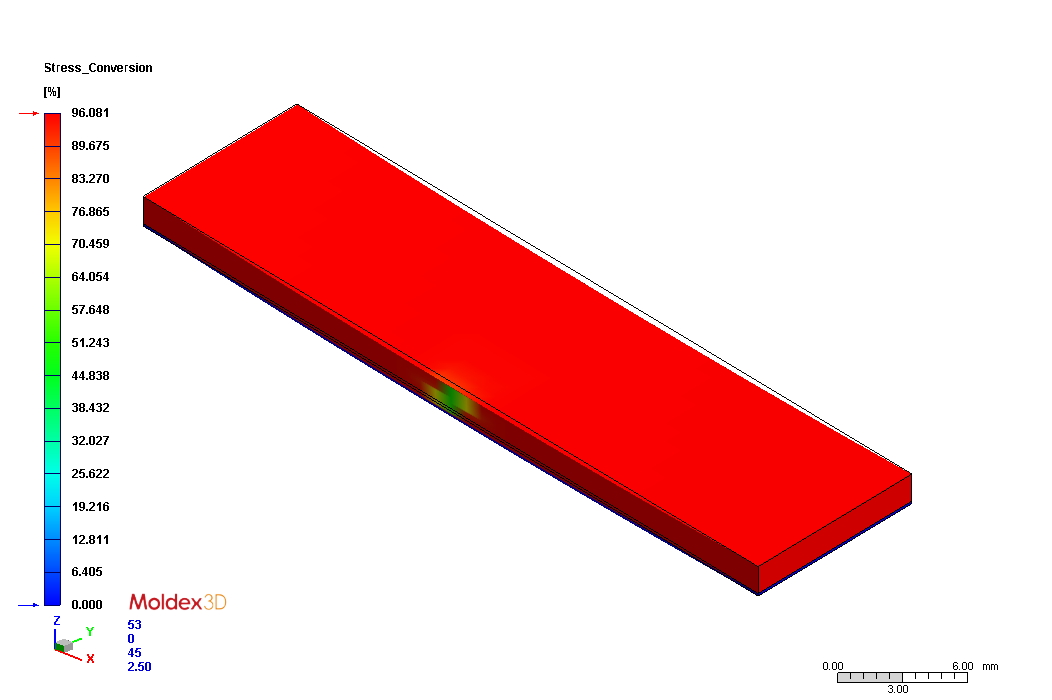 Fig. 3 Pre-oven result for stress conversion indicates degree of cross-linking.
The red zone indicates that most of the part is 96% cross-linked.
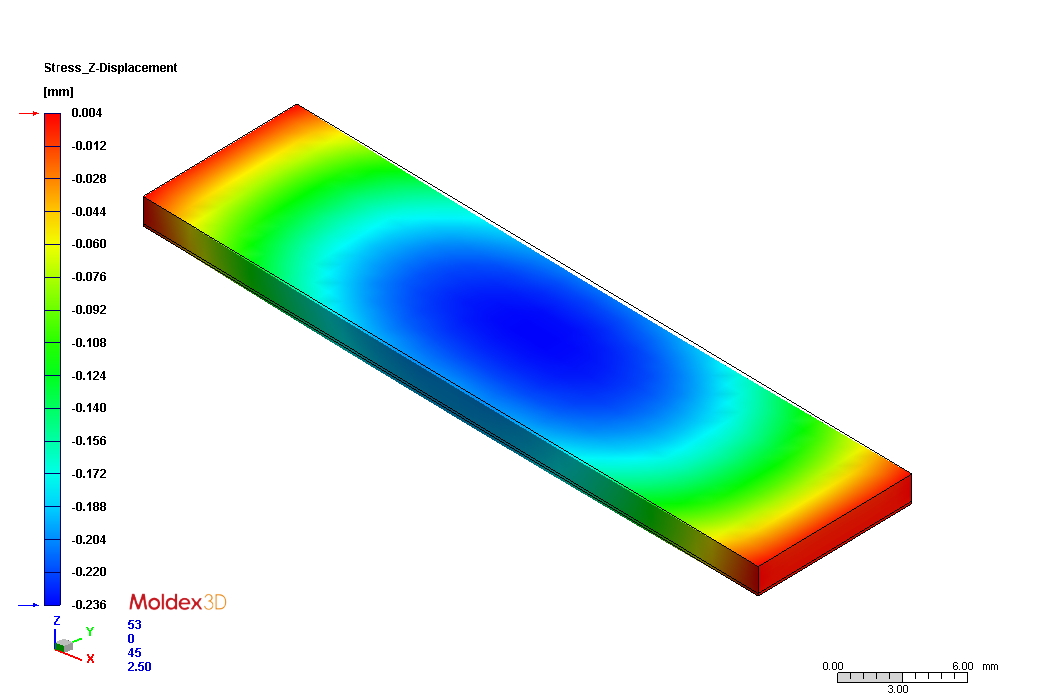 Fig. 4 The Z-displacement result indicates the degree of warpage across the part along the Z-axis (see bottom left corner of image for part orientation). The maximum pre-oven Z-displacement is -0.236mm, indicating the middle of the part displaces downward 0.236mm.
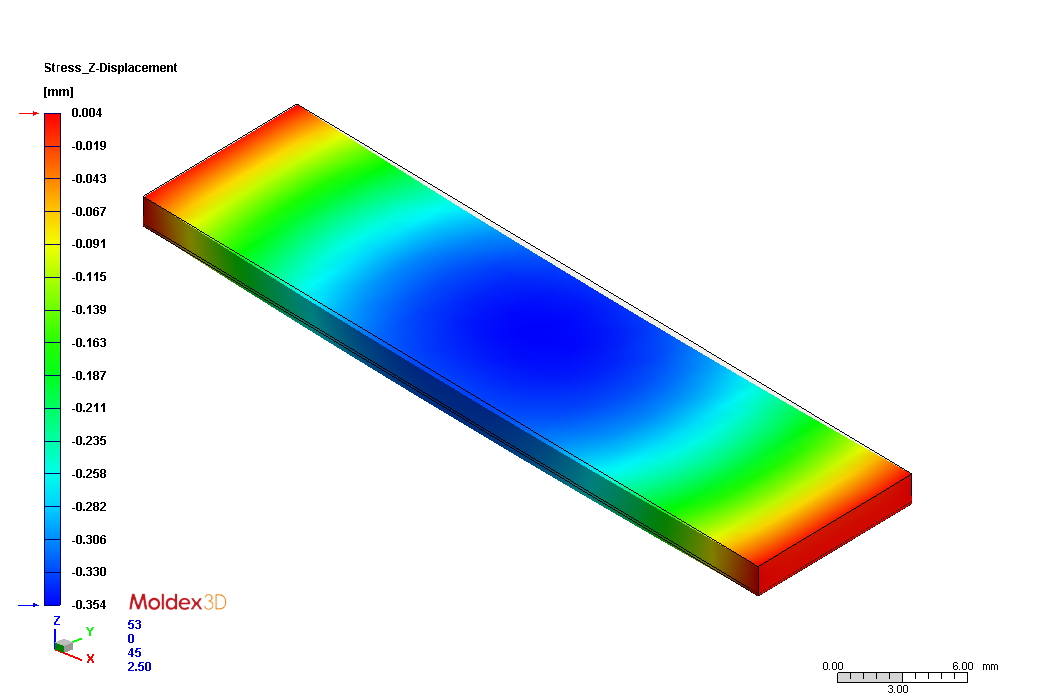 Fig. 5 The Z-displacement when the IC unit is removed from the oven to room temperature at the end of the post-mold cure process. The simulation of the final warpage is 0.354 mm, which is very close to the experiment result.
In summary, the goal of this case is to investigate the changes in product warpage results when the polymers inside the encapsulated unit are completely cross-linked and when the internal stress is released in the post-mold cure process. Both the simulation and experimental results show that a majority of the warpage amount is a result of the process of cross-linking. Based on this insight, we can also conclude that Moldex3D provides a reliable, in-depth understanding of visualizing warpage behavior in the post-mold cure stage. Users can apply Moldex3D’s accurate post-mold cure analysis in the design and manufacture for IC packaging process in order to make better arrangements to avoid excessive product warpage, which ultimately helps accelerate faster time-to-market and lower production costs.