
In response to high requirements from consumers for products in various fields, there is a trend focusing on light, thin, short, small and complex geometry. Furthermore, the time-to-market and short life cycle of product development require the use of scientific methods of rapid design. This can eliminate unnecessary trial and error approaches and result in development cost reduction. Therefore, adopting Taguchi techniques for experimentation can result in a reduction of the time and money required to conduct experiments. The factors that affect quality and stability can be identified and strengthening controls can be implemented in order to increase the yield rate of production.
Plastic injection molding professionals know when the mold design, mold construction and completion of post-production will take place. First, the procedures on the molding machine will be examined. The purpose of testing molding process stability is to determine if the product and mold design has poor appearance caused by defects. The size of the deviation is also calculated. Inappropriate molding conditions also will lead to poor results. Traditionally, molding conditions are usually based on the cumulative experience of the trial and error approach. When the products have problems or defects, the best way to solve them is by adjusting molding parameters and modifying the mold directly. But overcoming these solutions often requires the help of someone with a lot of experience. Without this, the problem will become even more serious.
Now, we can use the CAE simulation analysis software Moldex3D, to find the problem earlier. The DOE method can prevent unnecessary molding problems and shorten time-to-market.
What is Design of Experiment (DOE)?
DOE involves utilizing mathematical statistical methods, under certain cost and time limitations, to implement experiments. Expect to get as much information as possible from experimental data. The main purpose is to
- Improve the efficiency of accessing information
- To minimize experiment costs
Design of Experiment Method Types
- Trial and error
- One factor at a time experiments
- Full factorial experiments
- Taguchi’s orthogonal arrays
Moldex3D offers the following features to evaluate optimal process conditions:
- Efficient usage of experimental design (Design of Experiment, DOE), to help designers evaluate the most appropriate conditions and identify optimal conditions for molding parameters to achieve design optimization
- Non-conventional trial and error method, but by a systematic, scientific method, through simple set conditions. After the analysis, graphical summaries are automatically generated that can help users determine the optimal product quality results. It is effective in allowing users to achieve the best design.
- Supports thermoplastic and thermoset materials
- Supports the selection of multiple quality factors for DOE analysis by using the weighting function
- To obtain the optimized quality results with multiple quality factors, it easily finds optimal process conditions with each quality factor based on different weighting values
Industrial Case Study
Fig. 1 is the glove box inner component of a vehicle. This is a case study for evaluating. Nowadays, to reduce mold trial costs, people normally use CAE simulation mold trials to inspect potential problems. With increased quality requirements, the tolerance of assembly has become smaller and smaller. To meet design requirements, minimized warpage in the processing stage becomes necessary. Due to the large size of this glove box inner component (343.7 x 538.4 x 124.97 mm), warpage is very significant after molding. One can improve the warpage problem by using CAE and the design of experiment method. The mold temperature setting is different between the core and the side of the cavity, because the core side has many ribs and boss structures and it is easy for heat hesitation to develop. In the real molding settings, the cavity side mold temperature is set lower than the core side and the fixed temperature settings. The cavity side has variable parameters.
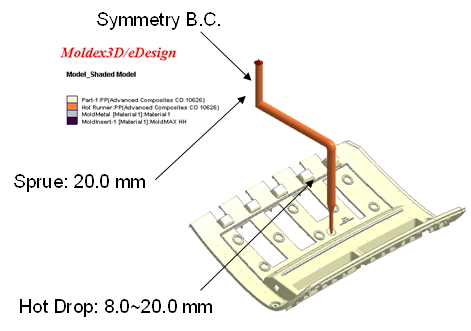 Fig. 1 Vehicle glove box inner component model
The main purpose of this case is to reduce warpage displacement, so the quality factor is total displacement. The smaller the characteristic is the better. Choose four significant parameters to be the control factor. That will affect the warpage condition. Control factors including melt temperature, which influence melt mobility and eventual temperature distribution; secondary parameters and mold temperature. The original temperature difference of the two sides and the fixing cavity side is 33.4 oC. The third and forth parameters are packing time and packing pressure. Table 1 is L9 Taguchi’s orthogonal arrays with four control factors and three levels.
Table 1 L9 Taguchi’s orthogonal arrays
| No. | Control factors | Level 1 | Level 2 (Original Design) |
Level 3 |
| Factor 1 | Melt temperature | 193.33 oC (380 oF) | 204.44 oC (400 oF) | 215.55 oC (420 oF) |
| Factor 2 | Mold temperature | 26.6 / 50 oC (80/122 oF) |
26.6 / 60 oC (80/140oF) |
26.6 / 70 oC (80 /158 oF) |
| Factor 3 | Packing time | 17 sec | 22 sec | 27 sec |
| Factor 4 | Packing pressure | 30.32 MPa (4398 psi) |
40.32 MPa (5848 psi) |
50.32 MPa (7298 psi) |
Fig. 2 is the Quality Response of the analytic results. From the response plot we can know the effect each factor directly has on the mold. The different levels reflect the effect between quality and the control factor. ANOVA shows that control factor 2(mold temp.) is the biggest factor.
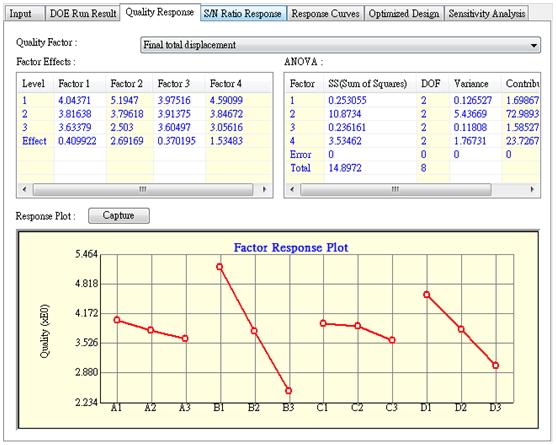 Fig. 2 Analytic Quality Response Results
Fig. 3 is the Signal/Noise ratio results. The higher S/N ratio means there will be smaller noise (external effect). The Taguchi method selected the maximum S/N ratio as the most optimal condition. The ANOVA of S/N ratio shows that the biggest contribution is from mold temperature and packing pressure. Thus we know that the optimal level is 1,3,3,3
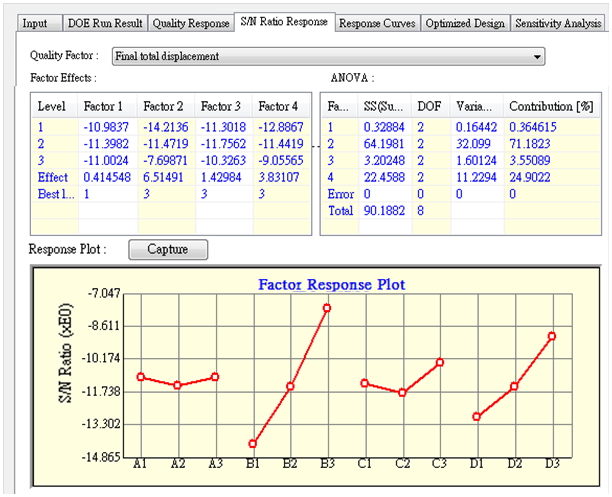 Fig. 3 Signal/ Noise ratio results
Finally, the results should be examined through a confirmation experiment. Table 2 is the Confirmation Experiment. To verify that the data from the analysis is correct you would use this table. Comparing the results of the factor response one can predict the S/N ratio and quality value of the original design and the optimized design. The optimal design for the original design is found through doing a set of experiments, and calculating the S/N ratio or quality value. Compare if the S/N ratio or quality values are consistent. Use the confirmation experiment since it has the same conditions that were used in the run. The value is totally the same.
Table 2 Confirmation Experiment Results
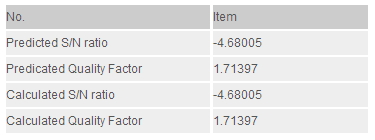
Fig. 4 shows the product displacement of the thickness direction between the original and optimized group. From the warpage results we can see the displacement becomes smaller and more uniform. In addition to reducing the deformed value, the uniformity of distribution is increased. The most important control factor is the differential mold temperature.
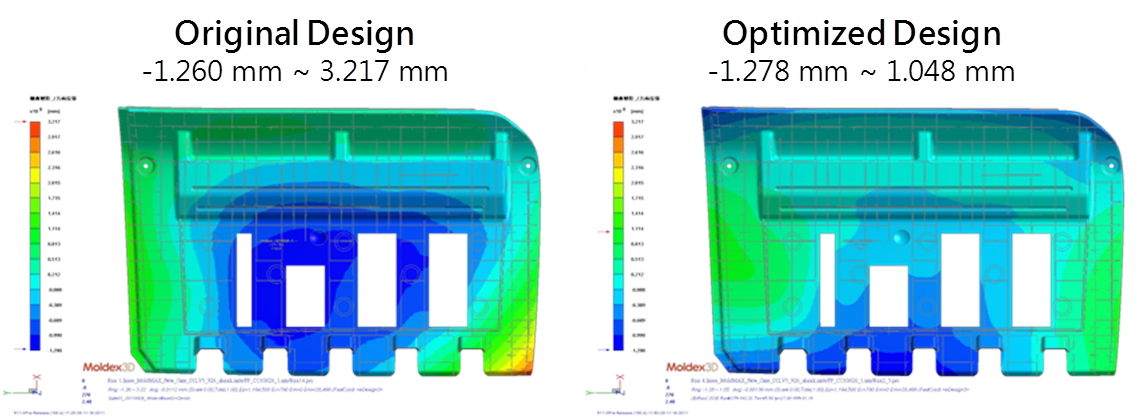 Fig. 4 Comparison of product displacements between original and optimized designs
Moldex3D provides a professional tool to help users determine optimal analysis results with automatic graphical summaries through very simple settings. It leads users to obtaining an optimized design effectively. Users can attain the effectiveness of an optimized method though using design of experiment (DOE) analysis. This method is used to help increase the productiveness of mold manufacturing, assist molding machine operators in finding optimal parameters and controlling product quality more precisely. To learn more about the new features and applications for optimal technology in the molding process, please visit www.moldex3d.com or contact us.