
In injection molding, we usually control the mold at a fixed temperature by making coolant continuously flow through the mold. If the coolant flow is not enough, or the coolant temperature is not as expected, the mold temperature won’t be able to keep at the designated temperature. The manufacturers of mold temperature controllers calculate the appropriate mold temperature controller specifications according to the size of the mold and the part. However, it can be a challenge for engineers and analysts using the simulation software to evaluate the performance of a mold temperature controller. In this article, we’ll share principles for using Moldex3D CAE software to better evaluate the performance of mold temperature controllers.
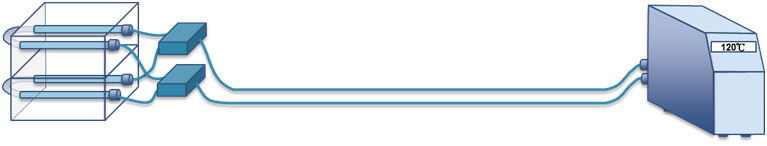
Fig. 1 A mold temperature controller and the cooling channels
The Relation between Flow and Pressure in Cooling Channels
In Moldex3D’s Flow analysis settings, users can apply two types of boundary conditions for cooling channels: flow rate and pressure. When the coolant flows through the cooling channel, the flow rate at the inlet and outlet are equal. Users only have to measure the flow rate at one side of the cooling channel, and the flow rate at the other side can be attained. Thus, using the flow rate as the boundary condition is easier to control. In terms of pressure, the inlet pressure is higher than the outlet pressure, and the flow is caused by this pressure difference. In Moldex3D, the default value of the outlet pressure is zero. Users only have to set the pressure boundary at the inlet, and this value will be equal to the pressure difference between the inlet and outlet. If we create a plot to show the relationship between the cooling channel flow rate and pressure, we can see that as the flow rate gets larger as the pressure difference gets larger. The two parameters are approximately proportional (Fig. 2).
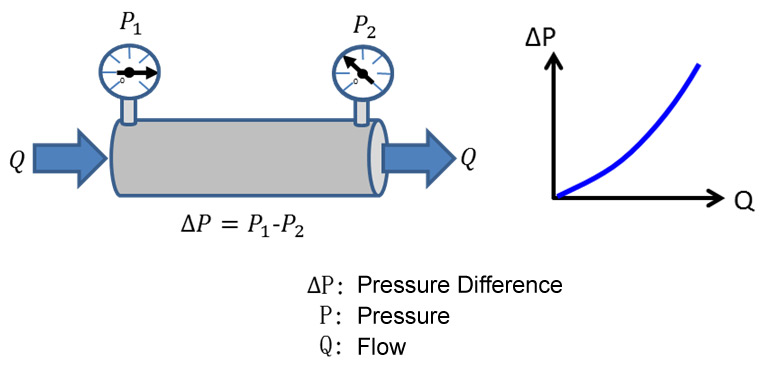
Fig. 2 The relation chart of cooling channel flow rate and pressure difference
Apart from the pressure difference, flow resistance is another factor that will affect flow. Flow resistance varies with some conditions, such as cooling channel diameters, channel length, channel wall smoothness, coolant properties, and flow rate. The Darcy–Weisbach equation shows the relations between these parameters (Fig. 3).
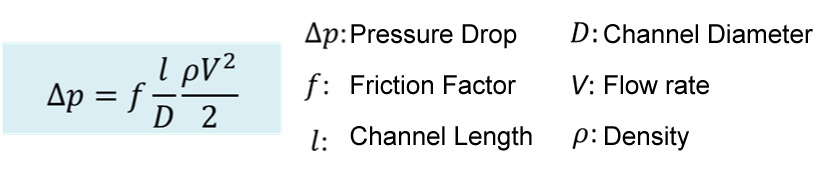
Fig. 3 Darcy–Weisbach equation
The Relation between Flow Rate and Pressure of Mold Temperature Controllers
The function of a mold temperature controller is to push the coolant to flow and stabilize the coolant temperature. The main function of the pump in the mold temperature controller is to push the coolant to flow. When the pump pressure rises, the flow rate decreases; when the flow rate increases, the pump pressure decreases. We can see the maximum flow rate and maximum pressure values on the mold temperature controller specification, but we have to note that the two conditions never exist simultaneously. We can see the mold temperature controller pressure is inversely proportional to the flow in the figure below (Fig. 4).
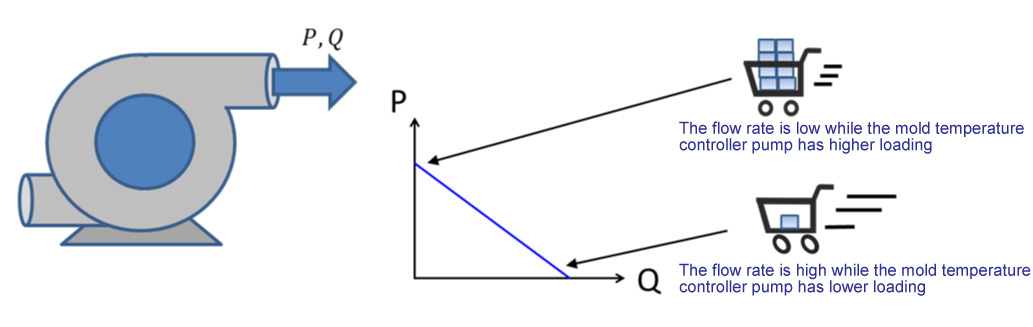
Fig. 4 The relationship between flow rate and pressure from the mold temperature controller pump
Choosing a Right Mold Temperature Controller with the Help of Injection Molding Simulation
Users can obtain the flow rate and pressure difference of every cooling channel through Moldex3D’s cooling channel analysis. The total flow rate of the cooling channels is the flow the mold temperature controller has to provide. The maximum pressure in the cooling channel is the minimum pressure the mold temperature controller has to provide. Users can enter point coordinates of the total flow rate and maximum pressure differences in the line graph. If the coordinate point is below the line, it means the mold temperature controller is able to provide enough flow rate and pressure. If the coordinate point is above the line, it means the mold temperature controller is not able to provide enough flow rate and pressure (Fig. 5). The latest version of Moldex3D, R17, is now able to provide the data of maximum pressure drop, total flow rate, and heat dissipation. Users can evaluate the mold temperature controller’s performance by adopting the pump performance curve.
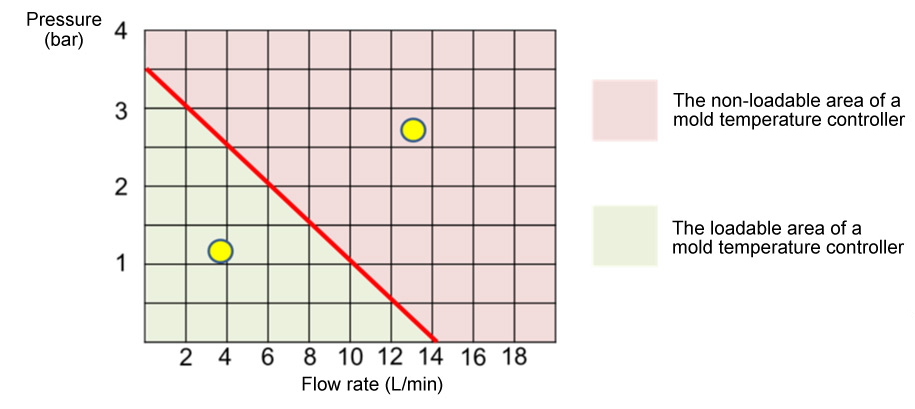
Fig. 5 The loadable area of the mold temperature controller
Things to Know before Running a Simulation
In the injection molding simulation, users usually set high flow rate as the ideal cooling channel condition. However, users will get a large value after converting it to meet the requirements of the mold temperature controllers. Therefore, in order to shorten the gap between simulation and reality, it is better to set the channel boundary conditions based on the actual specifications of the temperature controller unit. In addition to flow pressure, it is also necessary to take the cooling and heating capabilities of the mold temperature controller into consideration in simulation, users can check the heating load of the cooling channels and compare the values with the cooling and heating capabilities. If the cooling capability of the temperature controller exceeds the requirement of the predicted heating load of the cooling channel, or it’s heating capability exceeds the requirement of the negative heating load of the cooling channel, that means the mold temperature controller meets the requirement. Moldex3D also can export these crucial data gained from the Moldex3D Cooling analysis as a .csv format. (Fig. 6). Simulation technology can provide critical data to help evaluate mold temperature controllers, and it can greatly help them in evaluating a mold temperature controller in reality.
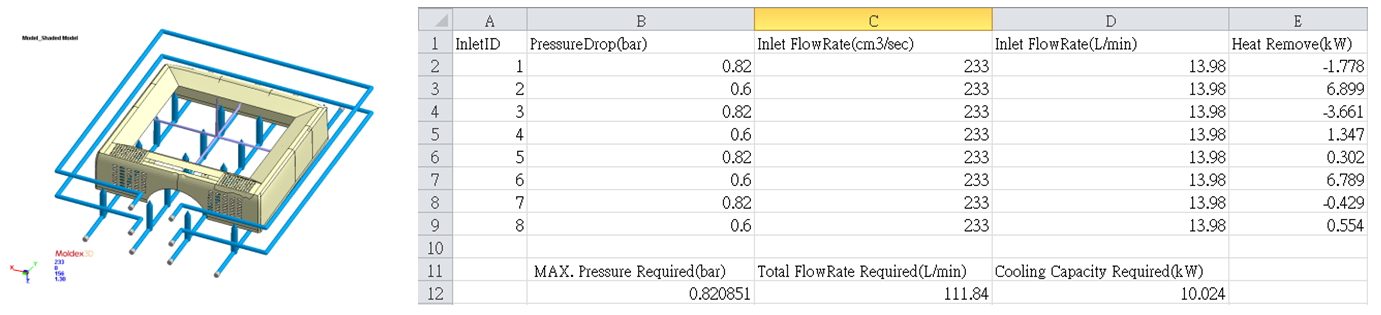
Fig. 6 The required cooling channel pressure, flow rate, and cooling capability