
Vacuum Resin Transfer Molding (VARTM) is a common, cost-effective practice applied in manufacturing wind turbine blades. The VARTM process involves the use of vacuum to facilitate resin flow into a fiber mat perform in a closed, single-sided mold caused by the difference between in-mold and outside atmospheric pressure. The process is capable of producing composites with a fiber volume fraction of 60% or more, making VARTM a highly efficient process that can be used to manufacture high quality products.
Due to a longer molding cycle, low viscosity and slow reactive resins are often chosen to ensure a proper filling without early curing during the filling stage, in which the viscosity of the resin will be affected by temperature, sheer stress rate and curing rate. In addition, as the curing rate keeps rising with time to the point when the viscosity is high enough for the part to be ejected, the resin can be seen as completely cured.
If the resin is ejected before it is completely cured, problems like unexpected product deformation can occur. To solve this problem, engineers have to fully understand the curing reaction and the rheological properties of the resin through a careful material characterization testing, and then utilize Moldex3D’s non-isothermal, true 3D simulation technology to predict how different thermosetting resins could affect the VARTM process. The following is a case of the outer cover of a carbon fiber wind turbine blade. We will utilize Moldex3D’s non-isothermal, true 3D simulation technology to investigate how different resin materials impact the filling and the curing behaviors.
First, a material characterization testing is conducted to obtain the accurate curing behaviors and rheological properties of Resin A &B. The changes of the curing and the viscosity behaviors of Resin A & B at 25℃ and 75℃ within a 4 hour timeframe are studied. The material characterization results are then compared with those attained from Moldex3D’s Material Wizard and based on the observations, we can observe that these two results both show the similar trends. That is, the curing rate and the viscosity of Resin B are both lower than Resin A’s under the same reaction time (Fig. 1 & Fig. 2).
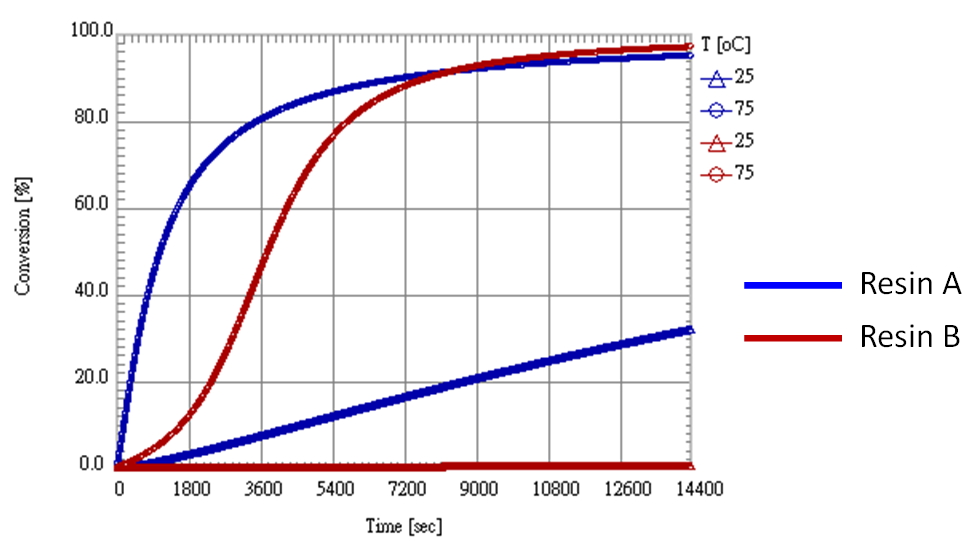 Fig. 1 The curing rates of Resin A and B at25℃ and 75℃
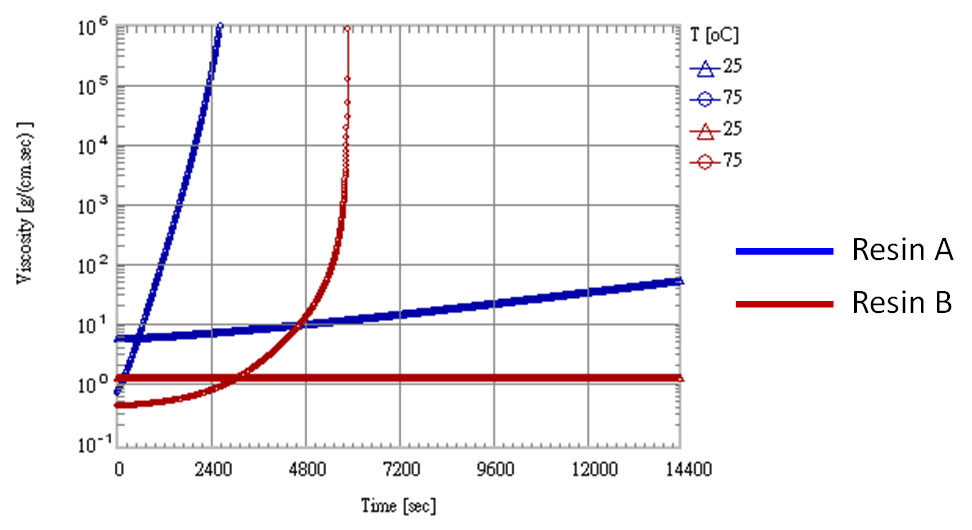 Fig. 2 The viscosity of Resin A and B at 25℃ and 75℃
The model used in this case is a 1kW wind turbine blade of a one-sided mold. The fiber layer and the design layout are shown in Fig. 3 and Fig. 4. When the filling reaches 99.8%, the curing process begins. At this stage, in order to accelerate the curing process, the mold temperature will be elevated from 25℃ to 75℃ (Fig. 5) so that the resin can cure faster and the part can be ejected sooner.
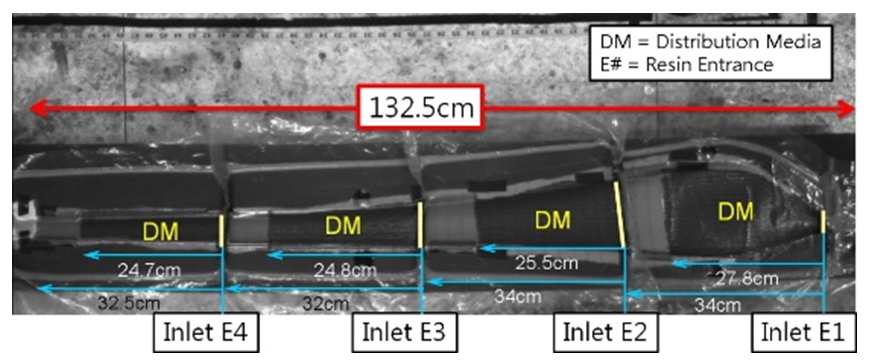 Fig. 3 The geometry of the part and the resin injection design
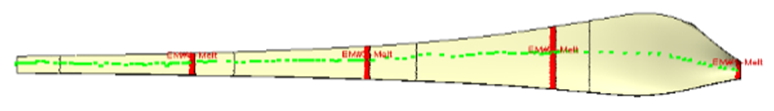 Fig. 4 The distribution of the sensor nodes on the outer cover of a wind turbine blade
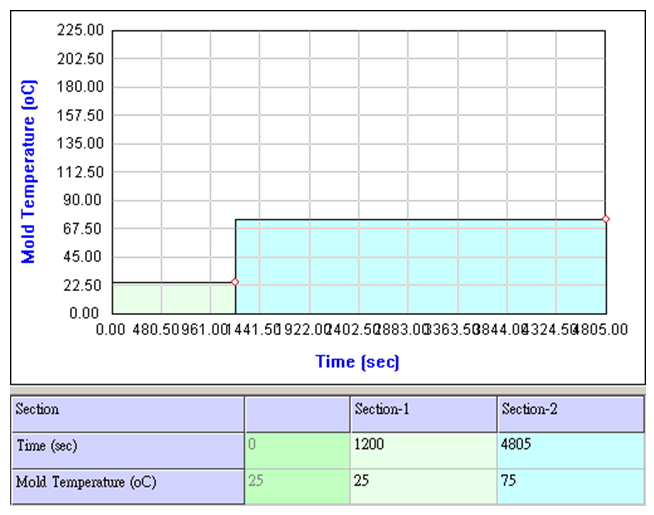 Fig. 5 The mold temperature settings
Table 1 shows the curing rate, viscosity and curing time of Resin A and B at different stages. As shown, Resin A has a higher viscosity and longer filling time, but its curing time is shorter. Resin B easily fills the mold while its curing time is longer. The total processing time of Resin A and B are 2.5 hours and 2 hours, respectively. Though there is only half an hour difference in the total processing time, their filling and curing times show a significant variation between the two resins. That is, Resin B has more processing advantages than Resin Adue to its lower viscosity and easy-to-fill characteristics. Thus, we can conclude that it is essential to understand the material properties first before we start to design to avoid unnecessary trial-and-errors.
| Resin A | Resin B | |
| Before Filling | ||
| Curing Rate | 0% | 0% |
| Viscosity | 710cps | 154cps |
| Filling Stage | ||
| Time | 1hr 27min | 17min |
| Curing Rate | ~11.5% | 0% |
| Viscosity | 1300 cps | 154cps |
| Curing Stage | ||
| Time | 1hr | 1hr 44min |
| Curing Rate | 75.00% | 81.40% |
| Viscosity | Completely Cured | Completely Cured |
| (1.3×10⁹ cps) | (2.5×10⁸ cps) | |
| Total Processing Time (Filling + Curing) | ||
| Time | 2hr 27min | 2hr 1min |
Table 1 The curing rate, viscosity and filling time of Resin A and B at different stages
Generally speaking, it is not easy to accurately control the curing time in an actual production. Especially when the mold temperature increases, the reaction will vary differently from one material to another; thus, it is extremely difficult to evaluate the material property changes merely based on the experience of the engineers. In order to have a better control of the VARTM process, we can utilize the material data attained from Moldex3D’s Material Wizard to further understand the material properties of different resins. Also, with the help of Moldex3D’s mold-filling analysis, we can better predict the resin’s flow behavior and curing reaction in order to find out the most appropriate mold temperature and processing parameters to maximize the benefits of using the VARTM process.