Authored by Lingo Shih, Engineer at Product R&D Division, Moldex3D
Injection molding is a very complicated process, and it is difficult to track the melt flow behaviors inside the cavity. However, to diagnose the molding issues, we have to understand the property variation at different locations. For example, we have to attain the temperature distribution information throughout the part surface so that we can understand cooling efficiency and balance. In order to help users deeply look into the molding process, Moldex3D Studio provides the Probe feature. The probe can be placed at many locations for data reading and generate the local history curve during the cycle time. Furthermore, through a group of Probe nodes in a sequence, it can draw the Distribution curves for the result variation at different key locations in the model. The steps for the XY Plotting of Distribution curves are as below.
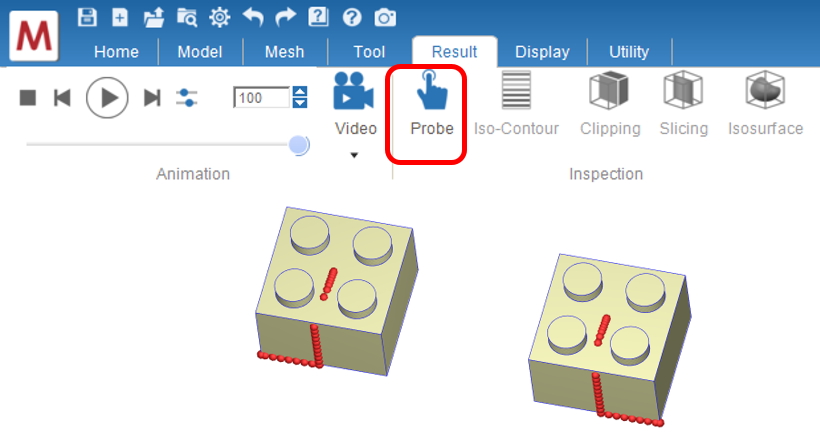
1. Place Probes in the Model
Step 1: Open a project in Moldex3D Studio with analysis results.
Step 2: In the Result tab, click on the Probe and click in the Display Window sequence to place a series of Probe nodes at the considered locations.
Note: The colors and show/hide of the Probes are controlled in the Model Tree.
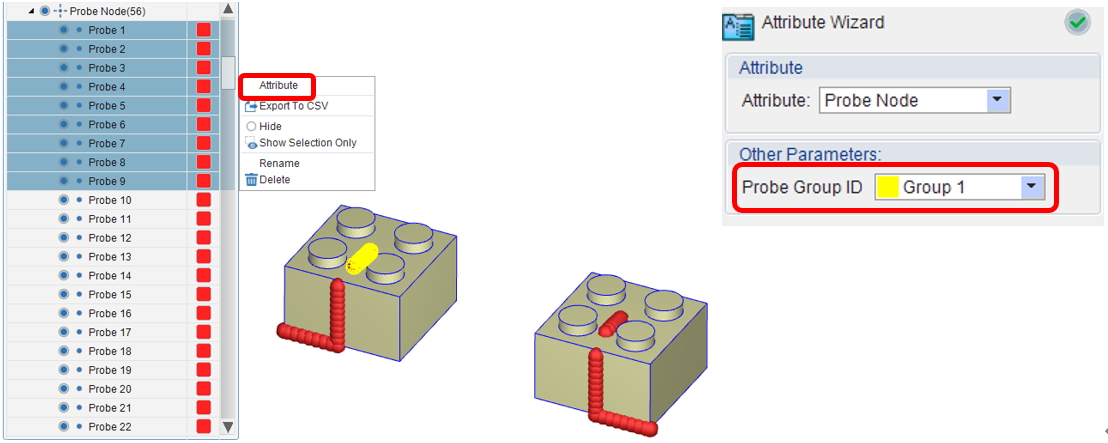
2. Group the Probe Nodes
Step 1: Select a series of Probe nodes and click Attribute from the right-click menu. Create a Probe Group ID and set the selected Probe nodes in one group.
Step 2: Repeat the previous step for other Probe node groups for more distribution curves.
Note: One group of the Probe nodes indicates one Distribution curve.
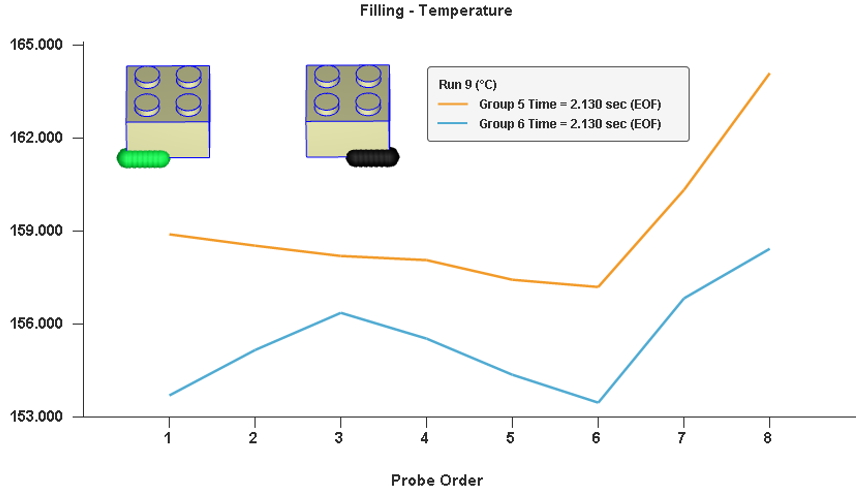
3. XY Plotting for the Distribution curves
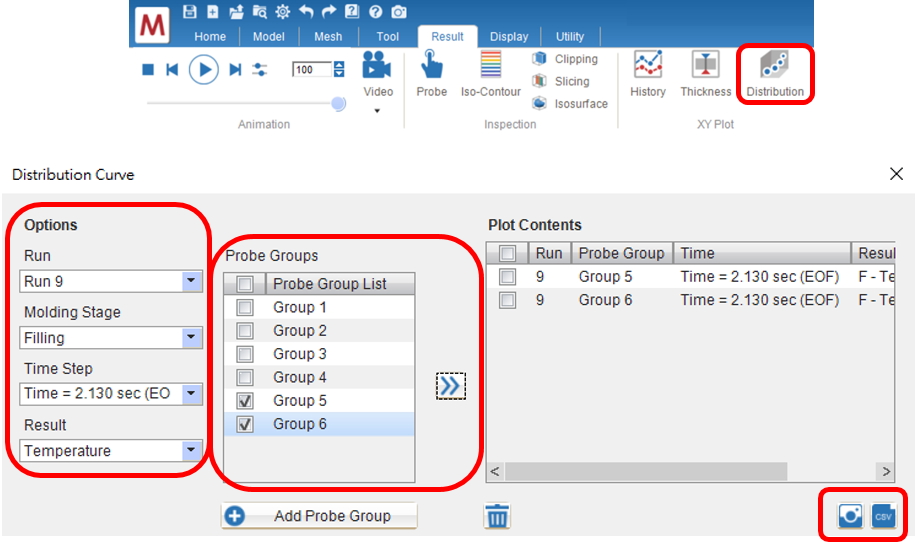
Step 1: Click Distribution in the Result tab to launch the XY Plot wizard.
Step 2: Specify the Molding Stage, Time Step, and Result for the analysis data to check the Distribution curves (the Y value in the plotting).
Step 3: Select the Probe groups and click Add (>>) to add them to the list of Plot Contents.
Note: Click the icons below the XY Plot wizard to add a new Probe group, remove the curves, export the data as CSV files, or save the plotting as pictures.
Note: Click the Edit Probe Group from the right-click menu to modify the group name and probe sequence.