Barton Lin, Chief Engineer at Technical Support Team, Moldex3D
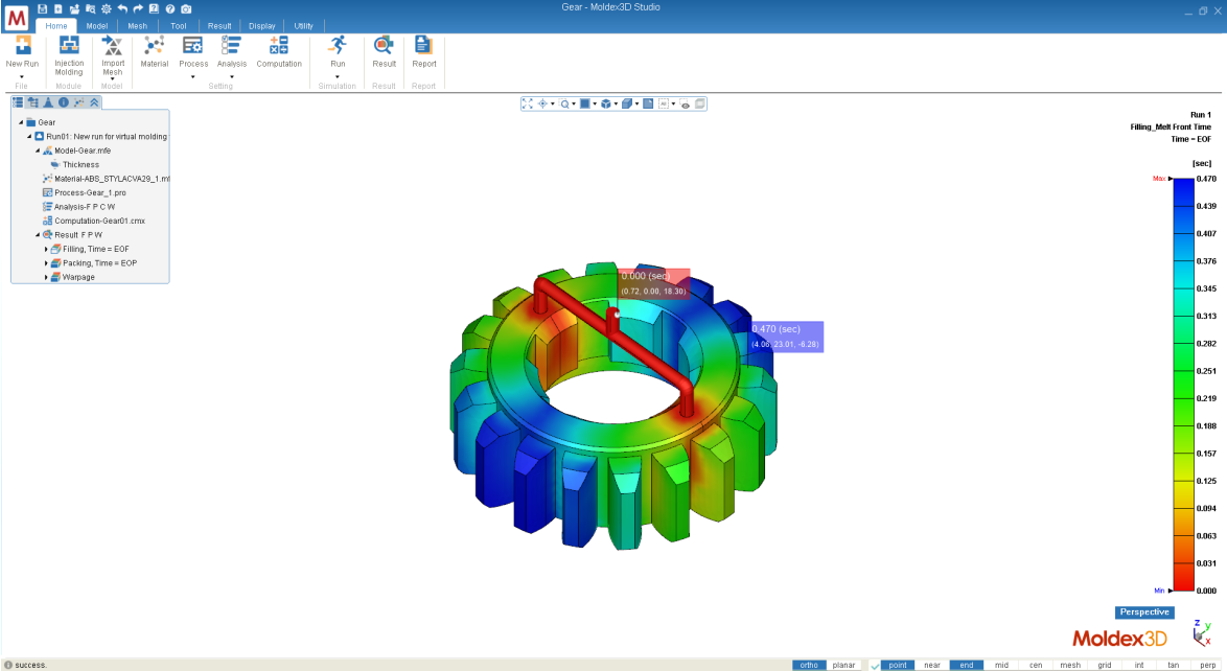
Moldex3D Studio is an integrated analytics platform. Through the intuitive Ribbon interface operation, users can perform all simulation work on one platform. The clear button design allows the model grid to be quickly completed and modified. Then, the model will be calculated by the solver, and the results can be displayed directly on the screen.
Moldex3D Studio also enhances the usability of the color legend. The functions are as below:
- The color legend can be placed on the left or right side of the screen.
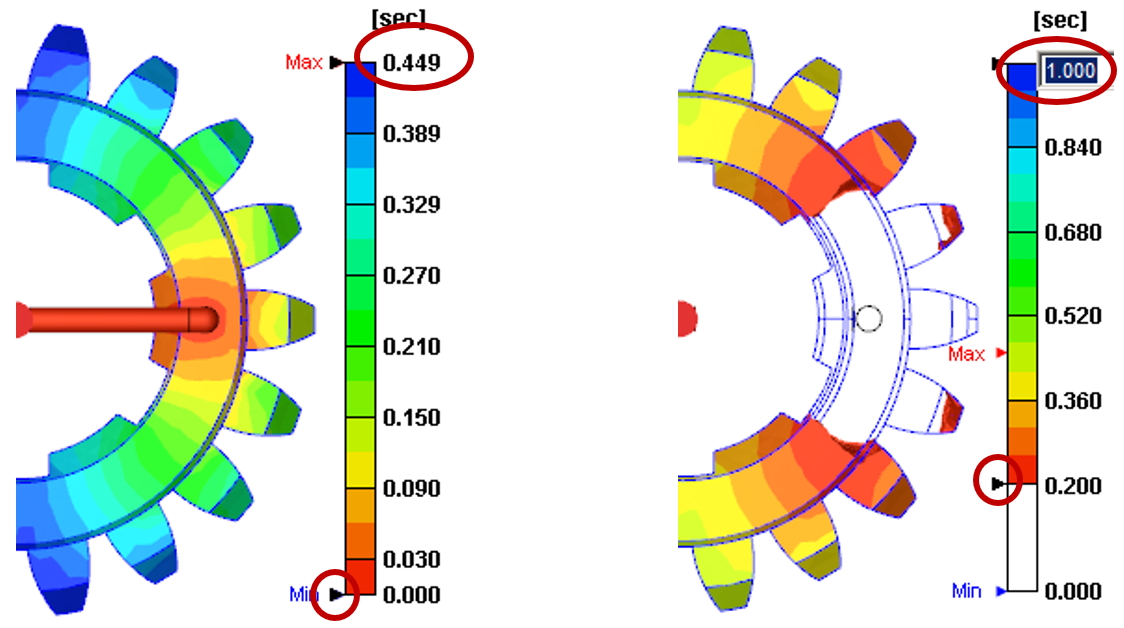
- Users can modify the value by double-clicking the upper and lower limits of the legend.
- Users can directly pull the range on the Legend to display.
- When the mouse is moved to the legend, a series of function buttons will appear (originally in the results tab).
In Moldex3D Studio, users can manually edit color legend directly, which is very helpful for the presentation and discussion of the analysis results.
Please refer to the following examples for the operation steps.
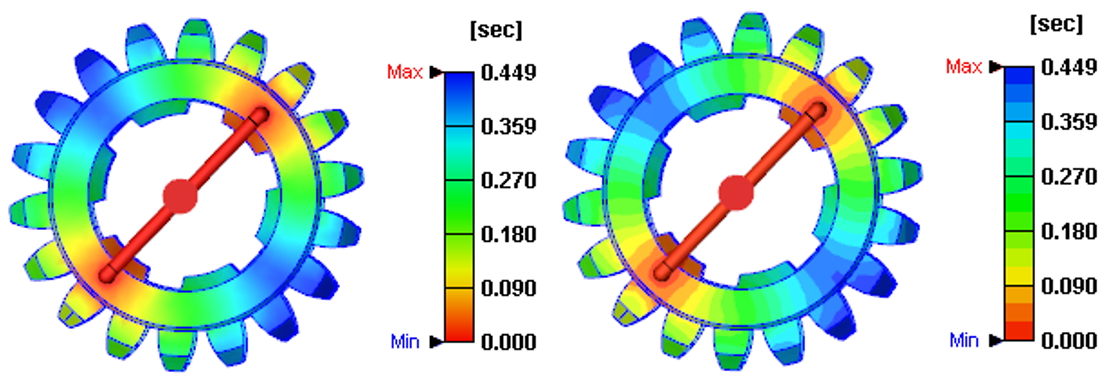
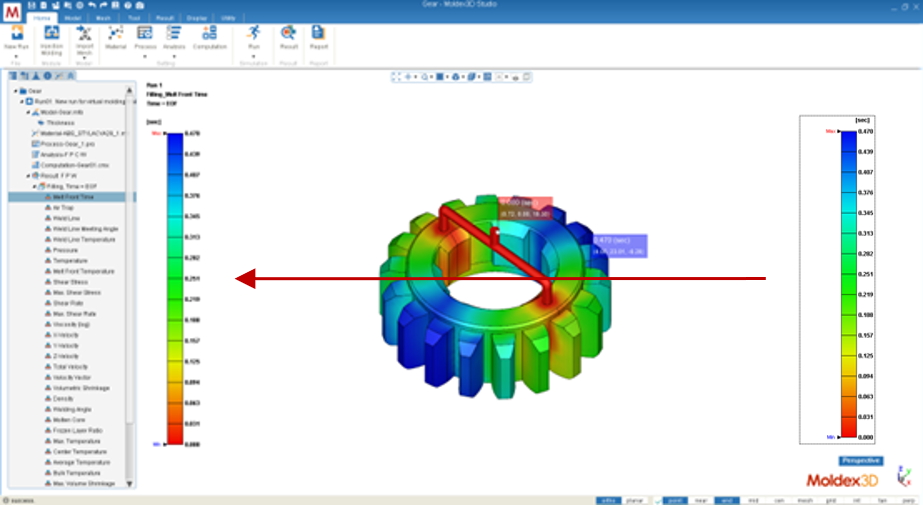
Step 1 Switch to a result item in Moldex3D Studio and the color legend is at one side in the Display Window.
Step 2 The defaults of the upper and lower limits of the color bar are the Max/Min values of the current result display. There are two ways to adjust Max/Min value directly on the color bar for better observation with specific purposes.
- Click and drag the black triangle mark to narrow down the color distribution (the upper limit below), and the out-of-range result value will become empty.
- Double click on the limit value (lower limit below) to modify it, and both the color bar and distribution will update based on the new limit. The Max/Min marks (red and blue) will stay at the same value as the current result.
Step 3 Move the cursor onto the color bar to enable the toolbar for customization options:
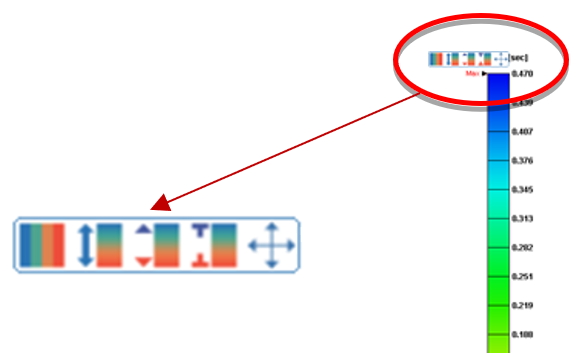
Move: click  and the color bar will show a dotted box indicating that it can be moved. Click on the color bar and drag it from left to right in the Display Window. (Note: When the Tree is folded, the legend placed on the left will also move.)
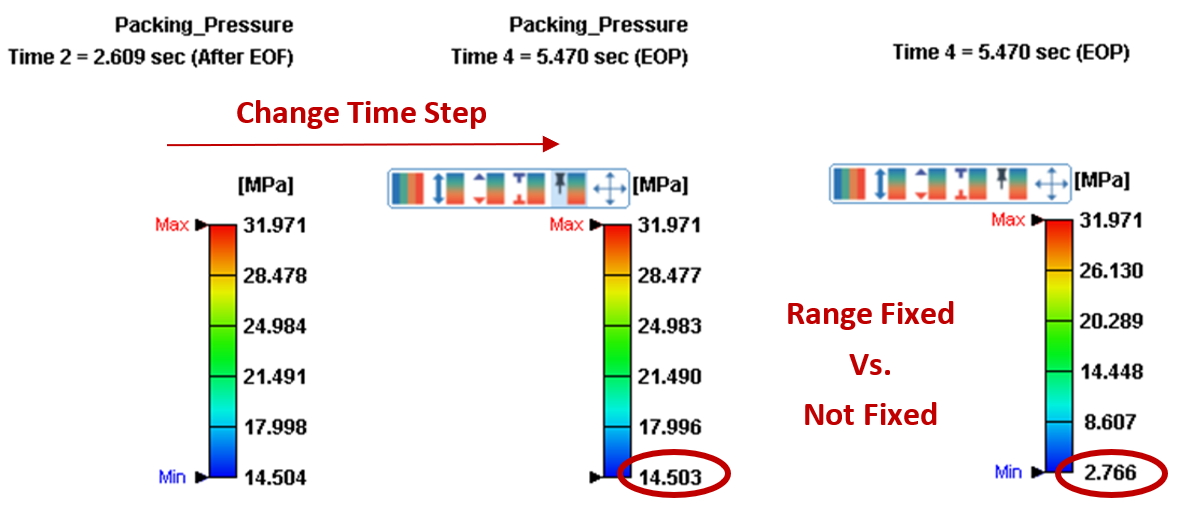
Fixed the range: Click  to fix the range of color legend or, otherwise, the range will vary through different time steps for different Max/Min values.
Reset the display range: Reset all the color bar option settings  from the customized to default.
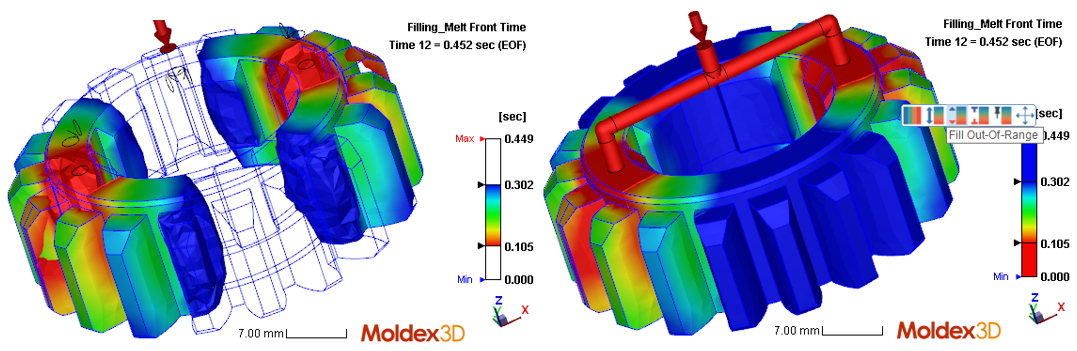
Fill in the out-of-range areas: click  to fill in the area with color of Max/Min if the result value is out of the current legend range. Otherwise, the area will show no color if this is option is disabled.
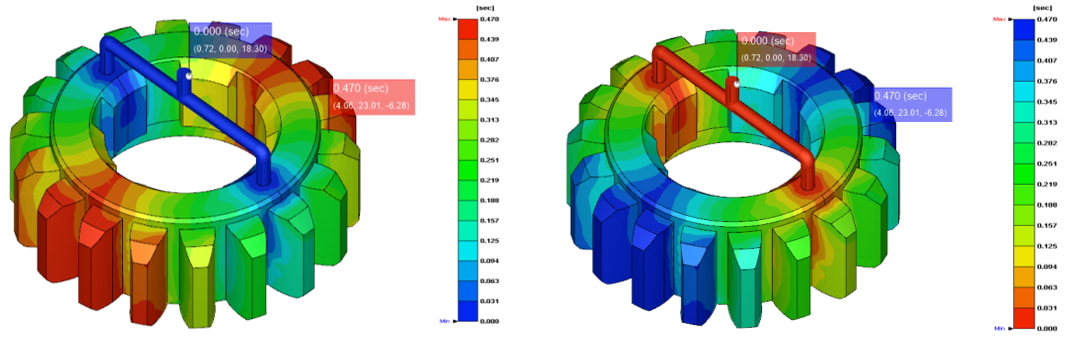
Inverse the legend color: Click  to Inverse the legend color.
Banded distribution: Click  to switch the color distribution from continuous to the banded style.