
Jye Wang, Manager at Moldex3D Material Research Center
Rheological behavior is one of the most complex and important properties in polymer processing. To complete a successful process simulation, reliable material data and models are necessary. The polymer flow can be predicted reasonably well with the assumption of inelastic (generalized Newtonian) fluids and the data from the capillary rheometer. However, the inelastic analysis may fail to describe the viscoelastic phenomena because polymers are viscoelastic in nature.
The typical curve of modulus and viscosity of an amorphous polymer is shown in Fig. 1 [1]. Basically, the elastic behavior gets more and more significant relative to the viscous behavior with the decrease of temperature. According to polymer physics, the state of a polymer can be divided into five regions. (1) glassy region; (2) glass transition; (3) rubbery region; (4) viscoelastic flow; (5) viscous flow. In the viscous region (5) the inelastic (or generalized Newtonian) model is the proper model to simulate the fluid flow. The elastic start to become more and more important from the viscoelastic flow region (4) to the rubbery region (3). The material behaves more and more solid-like (elastic) from glassy transition (2) to the glassy region (1).
In the filling stage, melt temperature is usually higher than the nozzle temperature because of viscous heating, the temperature falls in the viscous flow region indicating the inelastic (generalized Newtonian) models can be employed. In the packing stage, the melt temperature starts to cool down and it changes from viscoelastic (4) to rubbery (3), which indicates the elastic behavior starts to play a crucial role. After packing, polymer goes through glass transition in the cooling stage and reaches the glassy region in the ejection stage.
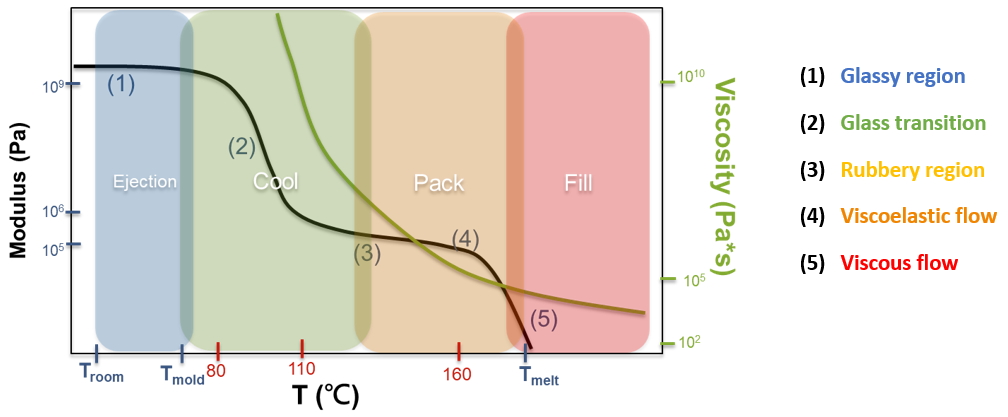
Fig. 1 Modulus and viscosity of amorphous polymer (the scales of polystyrene are indicated)
In addition to a stable viscoelastic solver, reliable material data and parameters of the mathematical model are necessary to complete a successful viscoelastic flow simulation. Several kinds of rheometer are installed, such as capillary rheometer, rotational rheometer, and DMA in the Moldex3D Material Research Center.
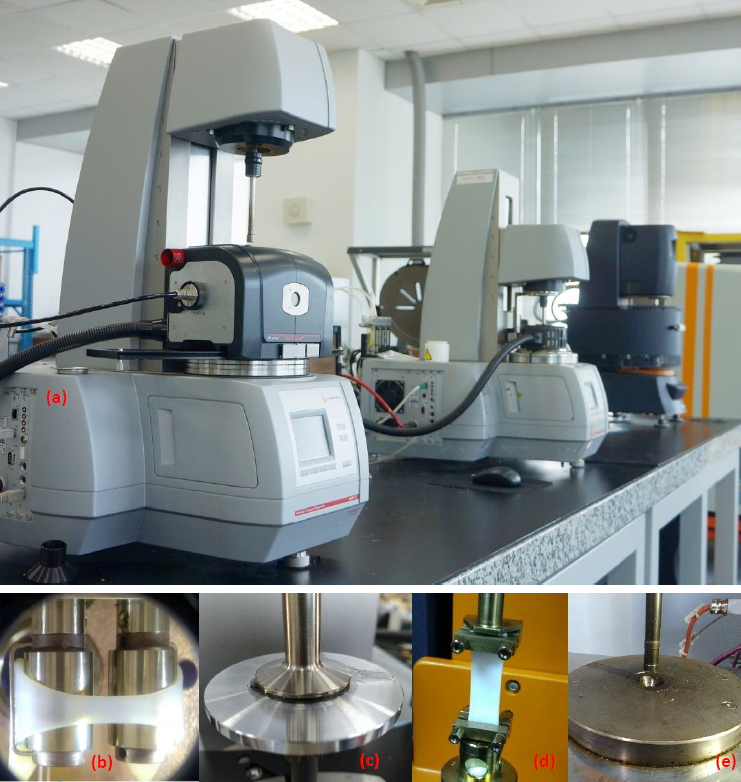
Fig. 2 (a) Rotational rheometers including Anton Paar MCR-502 and TA DHR-3; (b) Sentmanat Extensional Rheometer (SER) ; (c) fixture of parallel plate; (d) torsional fixture of DMA mode; (e) capillary rheometer.
Generally, the filling in injection molding is considered to have a high shear rate and high-temperature flow. Therefore, the capillary rheometer is generally the ideal instrument to characterize the flow behavior. However, there are certain regions in the cavity, such as the core layer or thick area, where the flow is under a low shear rate. In addition, the low temperature would be observed in the skin layers especially in the packing stage. Consequently, the viscosity data only from the capillary rheometer may not be enough to describe the whole process precisely. To extend the range of shear rate and temperature, parallel-plate and capillary rheometer are both employed. In addition, polymer melts with similar shear behavior may show very different extensional behavior especially for highly branched polymer[2]. Therefore, SER was used to obtain the rheological properties in the extensional flow field.
The measurable range of capillary rheometer has a high temperature (around process temperature) and a high shear rate (10 – 10,000 s-1). However, when it goes to the packing stage, its shear rate would suddenly decrease to less than 10 s-1, and the temperature would be lower than the filling stage. At the cooling stage, the temperature would be lower than Tg. The temperature and shear rate windows of the stages are shown in Fig. 3(a). Obviously, the temperature and shear rate of packing or cooling stages are outside the regular measurable range of capillary rheometer. We could take advantage of various instruments (including rotational rheometer and DMA) to obtain rheological data under a lower shear rate and temperature. The measurable ranges of these instruments are shown in Fig. 3(b).
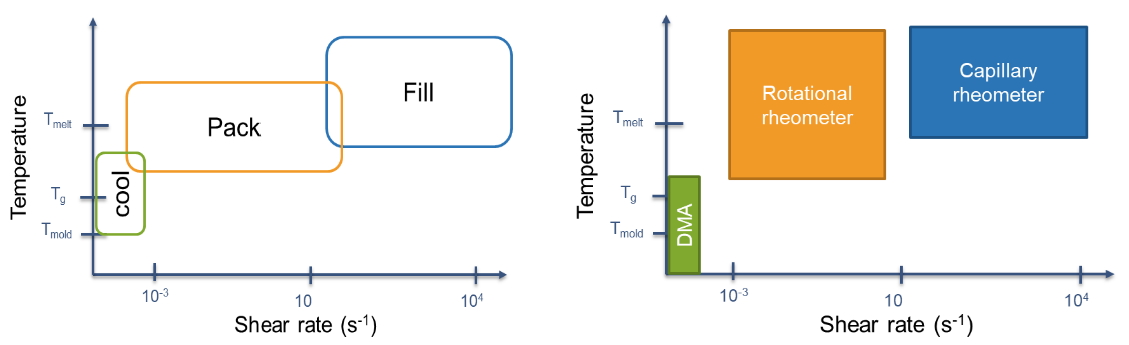
Fig 3. Temperature and shear rate windows of (a) various stages in injection molding; (b) various rheological instruments.
To model the polymer flow accurately for both filling and packing stages whose shear rates are from 104 to 10-3 s-1, we could integrate the data from the capillary and rotational rheometer. An example (polystyrene) is shown in Fig. 4.
The temperature of the polymer in the injection molding may range from melt temperature to mold temperature (ex. Tmelt ≈ 200℃and Tmold ≈ 60℃ for PS). To obtain reliable rheological data, we could combine the rotational rheometer and DMA. Fig. 5 shows the dynamic moduli of PS from melt temperature (200℃)to the glassy state (30℃).
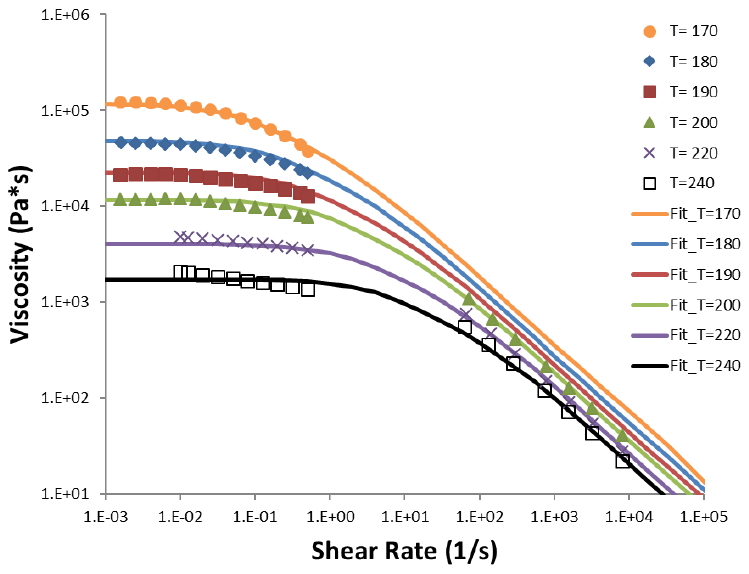
Fig. 4 Shear viscosity from both capillary and rotational rheometer.
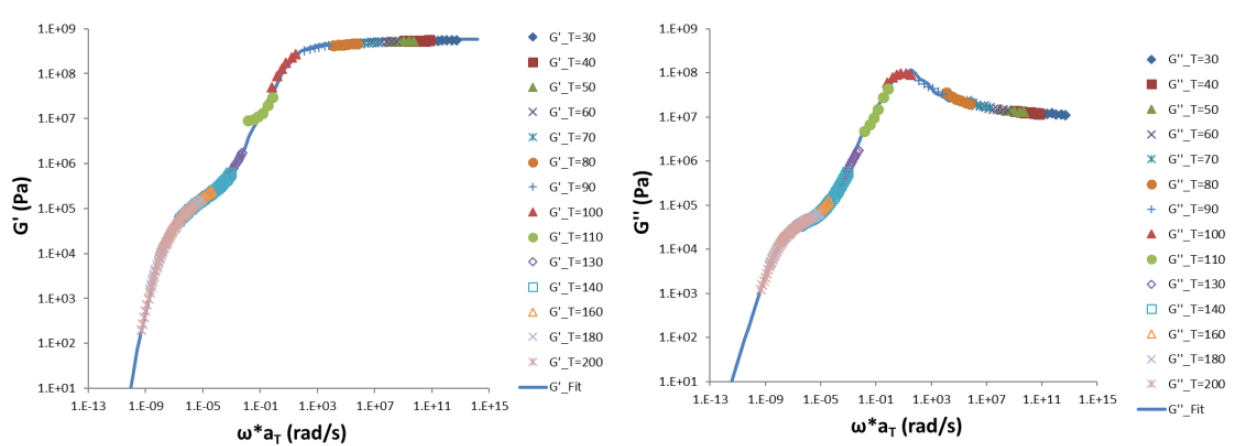
Fig. 5 Master curve dynamic moduli from both rotational rheometer and DMA
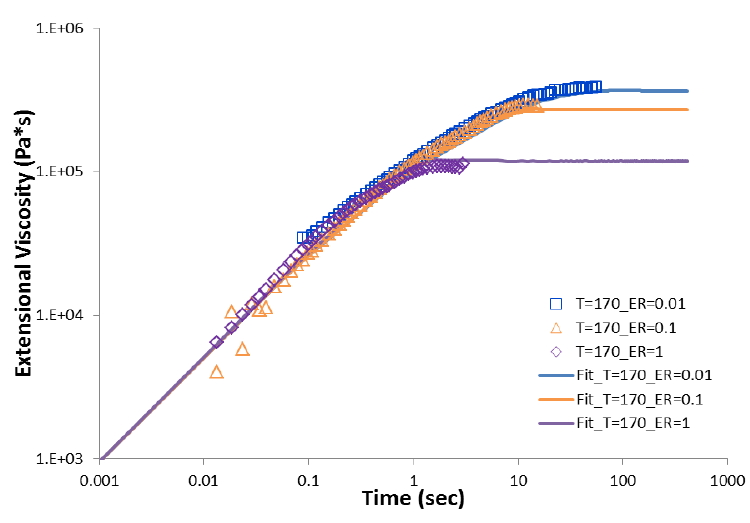
Fig. 6 extensional viscosity from SER
Viscoelastic model could be used to fit the rheological data from various instruments. The example EPTT are shown in Fig. 4-6 as the solid line). The model is applied into the Moldex3D viscoelastic flow solver.
A mold geometry including the runner and the injection nozzle unit is shown in Fig. 7 (a). The thickness of the part is 2mm, and the width and length are both 60 mm. Real injection molding experiments of polystyrene are conducted for validation. The comparison between experimental and simulation for various packing pressure are shown in Fig. 7(b). It is found the simulations are consistent with the experimental curves during the entire filling and packing stages except the moment right after V/P switch, which is strongly affected by the machine response. The peak pressure of experiments located on V/P is 53.7±0.3 (MPa) which is very close to the simulation result 54.6 (MPa).
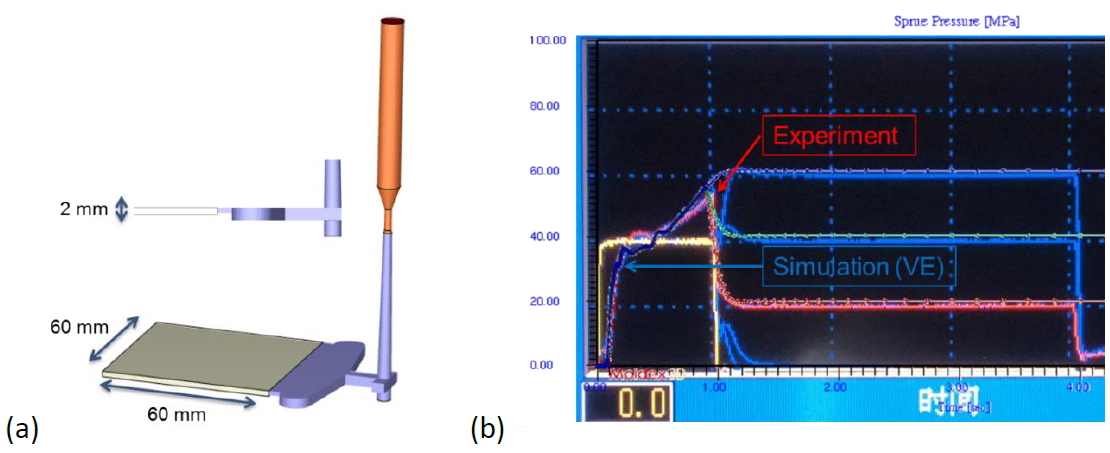
Fig. 7(a) geometry of the injection mold; (b) sprue pressure curves of experiments and simulation.
If we look into the detail in the injection process by Moldex3D, we can find that the shear rate distribution during filling is about 2,000 to 7,000 s-1 in the runner, and 600 to 1,000 s-1 in the cavity, as shown in Fig. 8. These shear rates fall in the range of capillary rheometer. Fig. 9 shows the shear rate distribution in the packing stage. The shear rate is lower than 20 s-1 in the runner and less than 1 s-1 in the cavity, which falls outside the measurable range of capillary rheometer. In other words, not only the temperature but also the shear rate measurable ranges of capillary rheometer are not wide enough to cover the packing simulation.
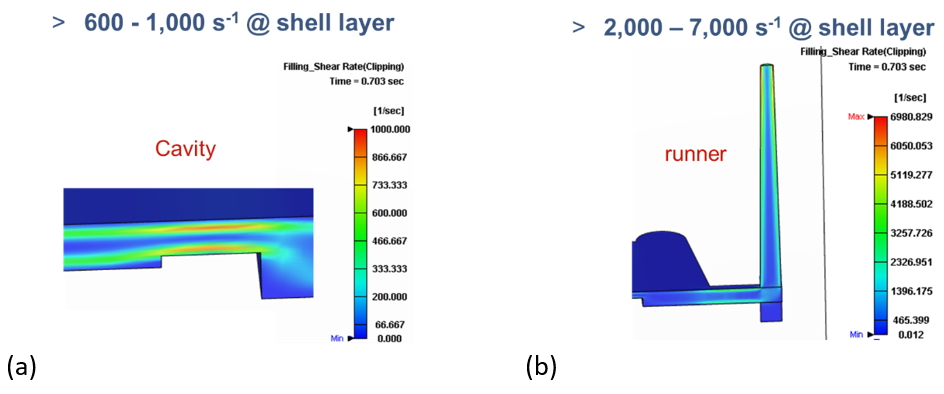
Fig. 8 Shear rate distribution at end of filling in (a) cavity (b) runner
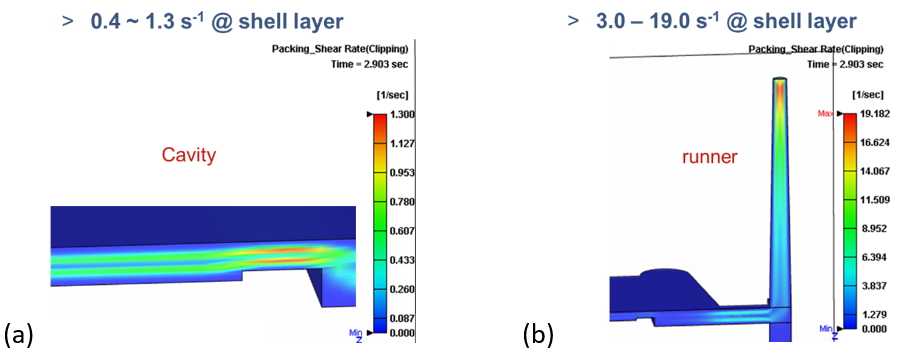
Fig. 9 Shear rate distribution at the packing stage in (a) cavity (b) runner.
Fig. 10 shows the temperature in the packing stage. It is lower than 180℃ in the shell layer of the runner, and it is lower than 140℃ in the cavity. Obviously, the temperatures are outside the range of the capillary rheometer again. Moreover, they are in the range of temperature from the viscoelastic region to the rubbery region, in which elastic behavior plays an important role. Consequently, the rotational rheometer contributes to obtaining a low shear rate and low-temperature data to complete a successful simulation, especially in the packing stage.
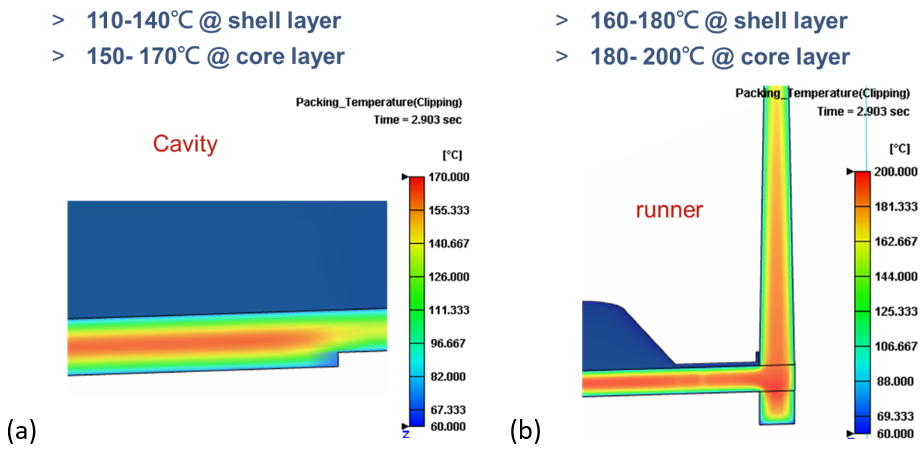
Fig. 10 Temperature distribution at the packing stage in (a) cavity (b) runner.
In summary, to simulate the whole injection molding process more realistically and more accurately, we could combine various instruments to obtain a wide range of rheological data. However, it will take strong supports from material suppliers to help increase the general availability of viscoelastic data.
Reference
- Shaw, M. T.; MacKnight, W. J. Introduction to Polymer Viscoelasticity; Wiley, 2005.
- Macosko, C. W. Rheology: Principles, Measurements, and Applications; Wiley, 1994.