
Wayne Chang, Engineer at Product R&D Division of CoreTech System (Moldex3D)
To perform CAE analysis in the product design stage, a series of work items need to be conducted, as shown in Fig. 1. First, the CAD engineer should create a geometric model in CAD software, and then output the geometric model file. Next, the CAE engineer inputs the model file into the CAE software, and completes the settings such as boundary conditions, material selection, mesh generation, and molding conditions, and then CAE analysis can be performed. After CAE analysis, the CAE engineer has to interpret the results. If the CAE interpretation shows that there are defects in the molding, it must go back to the CAD software to modify the product model, and then repeat all the same processes, until the product model design is optimized for mass production. When a product design is changed, the whole workflow must be repeated. The processes of file transfer and CAE calculation are also required, consuming a lot of time and labor effort. Also, such a workflow cannot be done by a CAD engineer alone. The reason is, that CAD engineers have CAD editing capabilities, but lack experience with CAE analysis and optimization tools.
To solve this issue, Moldex3D has developed a new feature – Design Parameter Study (DPS) in Moldex3D SYNC, which enables automatic analysis and helps users to quickly complete the entire CAE analysis process.
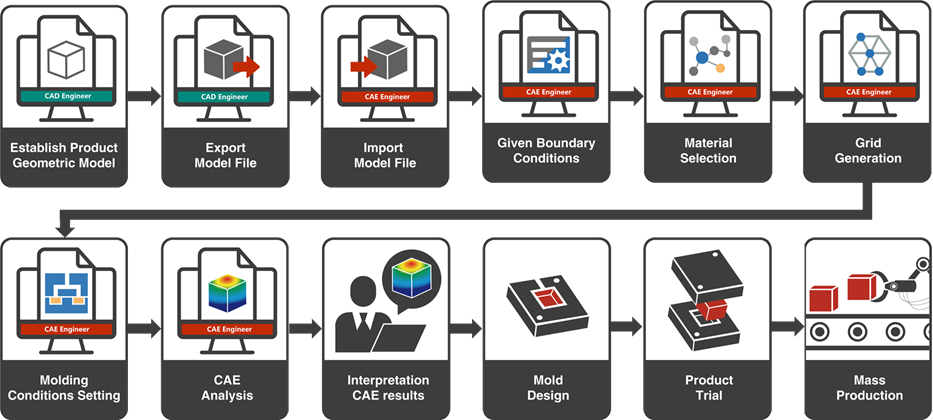
Fig. 1 The workflow of CAE analysis
Moldex3D SYNC Design Parameter Study (DPS)
In the design parameter study (DPS) workflow, a set of reference groups is required for the optimization. After finding the results that need to be improved from the CAE analysis results of the reference group, CAD engineers can use geometric parameters or new models directly with their familiar CAD geometry editing tools to change geometric shapes and sizes that can affect the geometric parameters of the targeted result items.
Next, users can select the geometric features through the control factors in DPS and set the upper and lower limits and the variation amount for each feature. Lastly, full factorial design (FFD) and the Taguchi method are provided for different combinations of design changes. Each combination contains different shape and size settings, and there can be dozens of combinations. DPS will automatically generate corresponding 3D geometries according to different size designs. After the geometries pass the inspection, the steps including solid mesh generation, boundary condition, material, and molding condition settings will be automatically done. Then, it starts CAE analysis and performs parallel calculations on the design combination to reduce the waiting time of CAE analysis. In this way, analysis can be automated, avoiding manual operations and the induced incorrect settings.
After analysis, DPS summarizes all design parameter combinations and analysis results on a graph. Product designers can view molding data for each design parameter combination to find the optimal one.
Actual Case Demonstration
In the case in Fig. 2, the weld line appears at the weaker part of the product. By changing the product design, we can move the weld line positions closer to the stronger structure. First, we use the CAD feature to change the part thickness of specific areas to change the weld line position (Fig. 3). Use the DPS feature to optimize the change parameters of thickness. For the control factor, choose the characteristic of thickness changes; for the quality factor, choose backflow check, as shown in Fig. 4. The definition of backflow check is the forward percentage of melt flow. We can check if the weld lines will appear in the specific areas from this. In the end, the optimization analysis is carried out with the full factorial design method.
Note: The so-called “Back Flow Check” means we have to specify a line segment, set its direction to record the melt front’s distribution on it, and obtain the degree of how the flow trend (direction) matches this direction (forward flow). The larger the value of the quality factor, the more consistent the direction of the melt flow direction in this area, that is, the weld line is further away or not appearing.
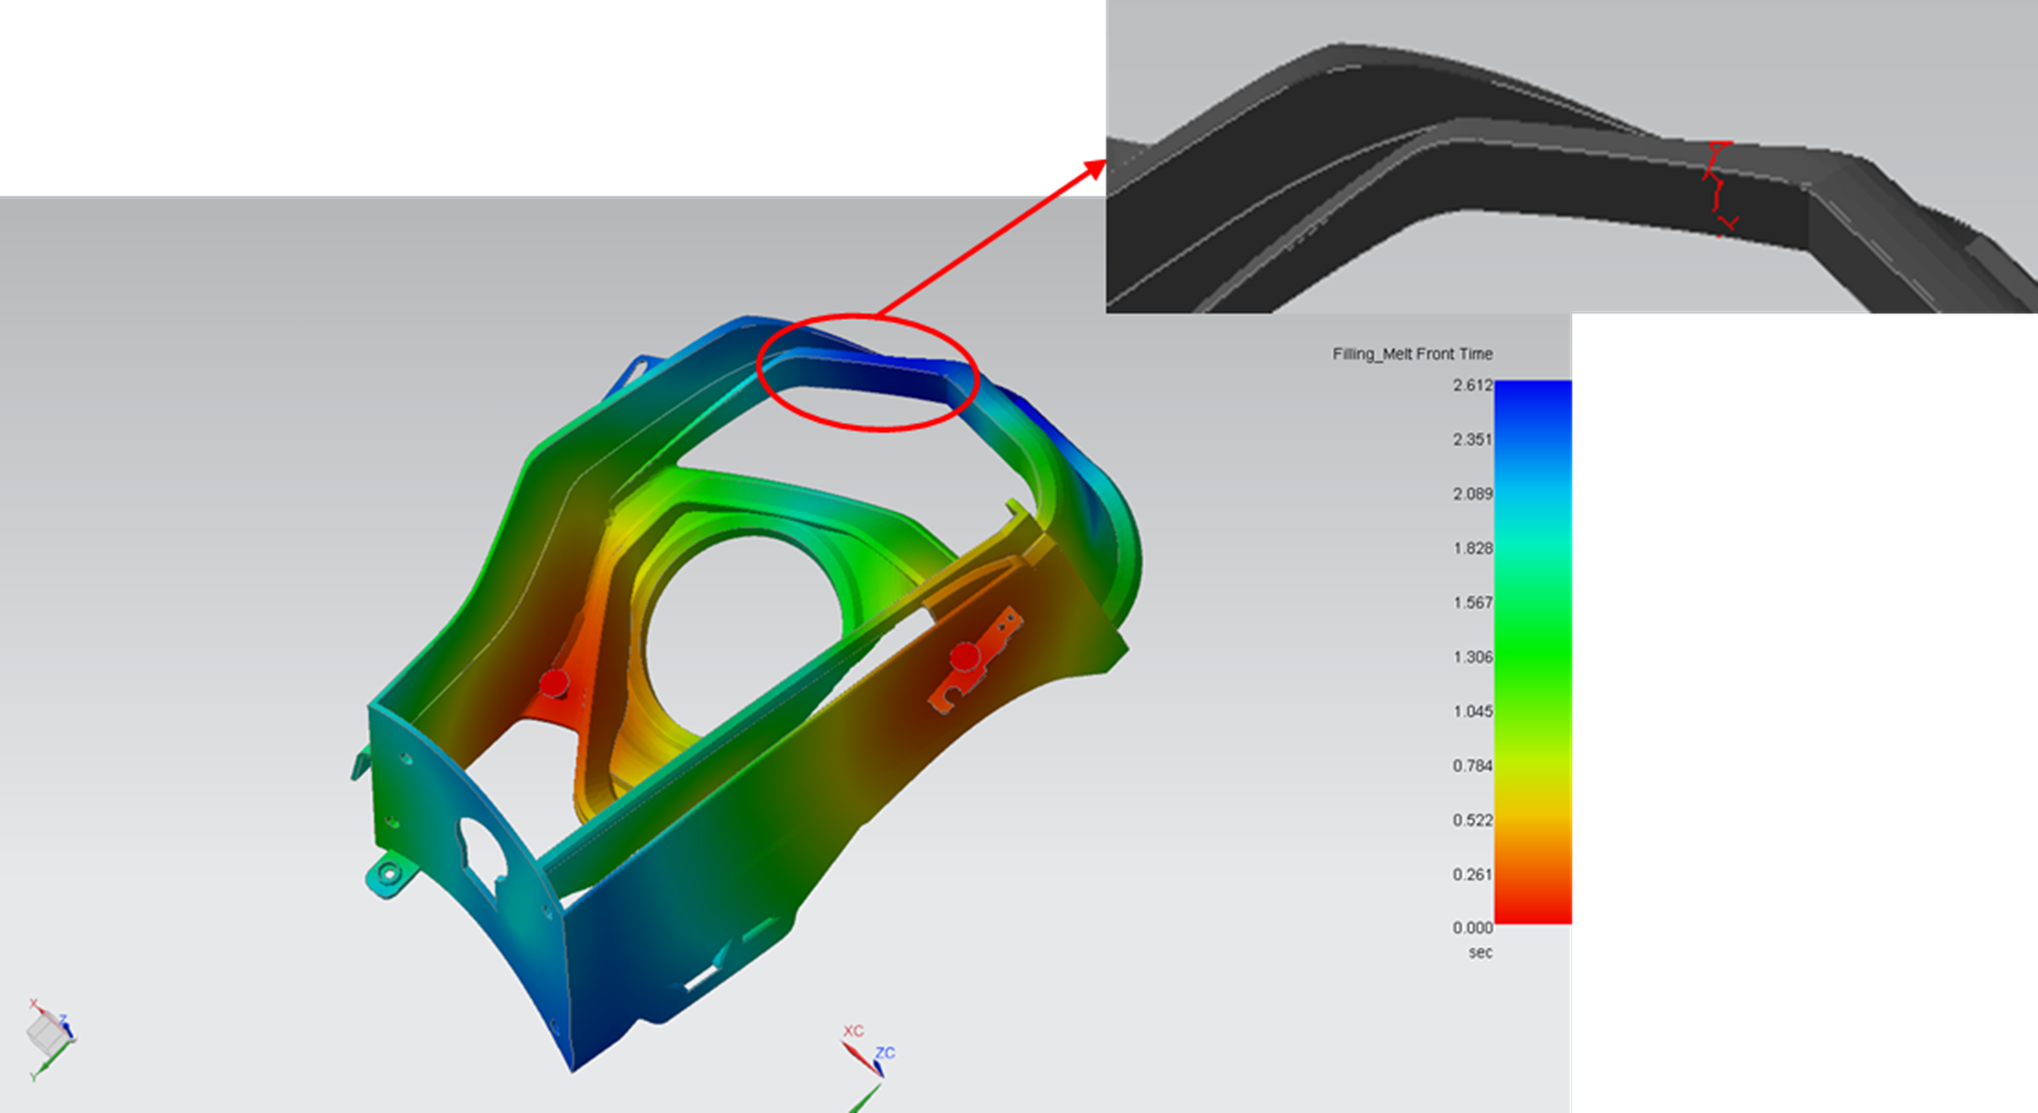
Fig. 2 The weld line position in the real case
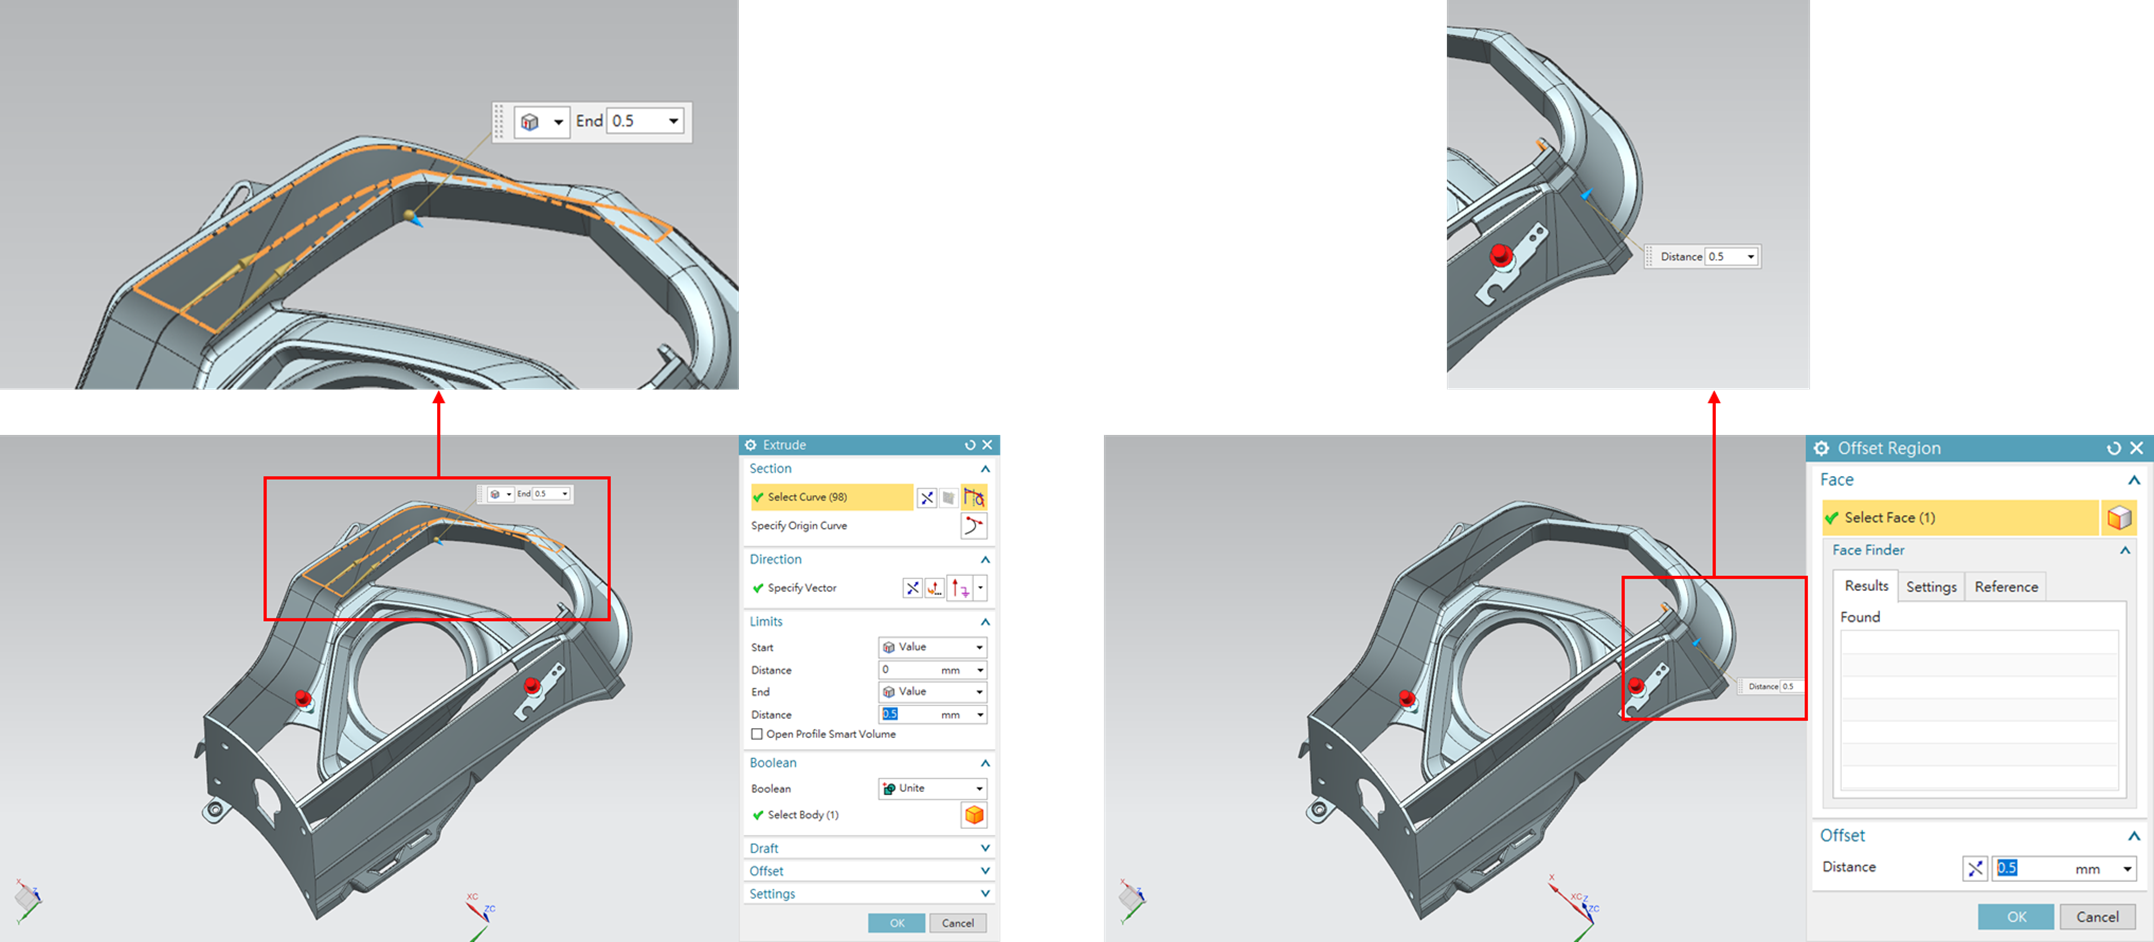
Fig. 3 Position to change thickness
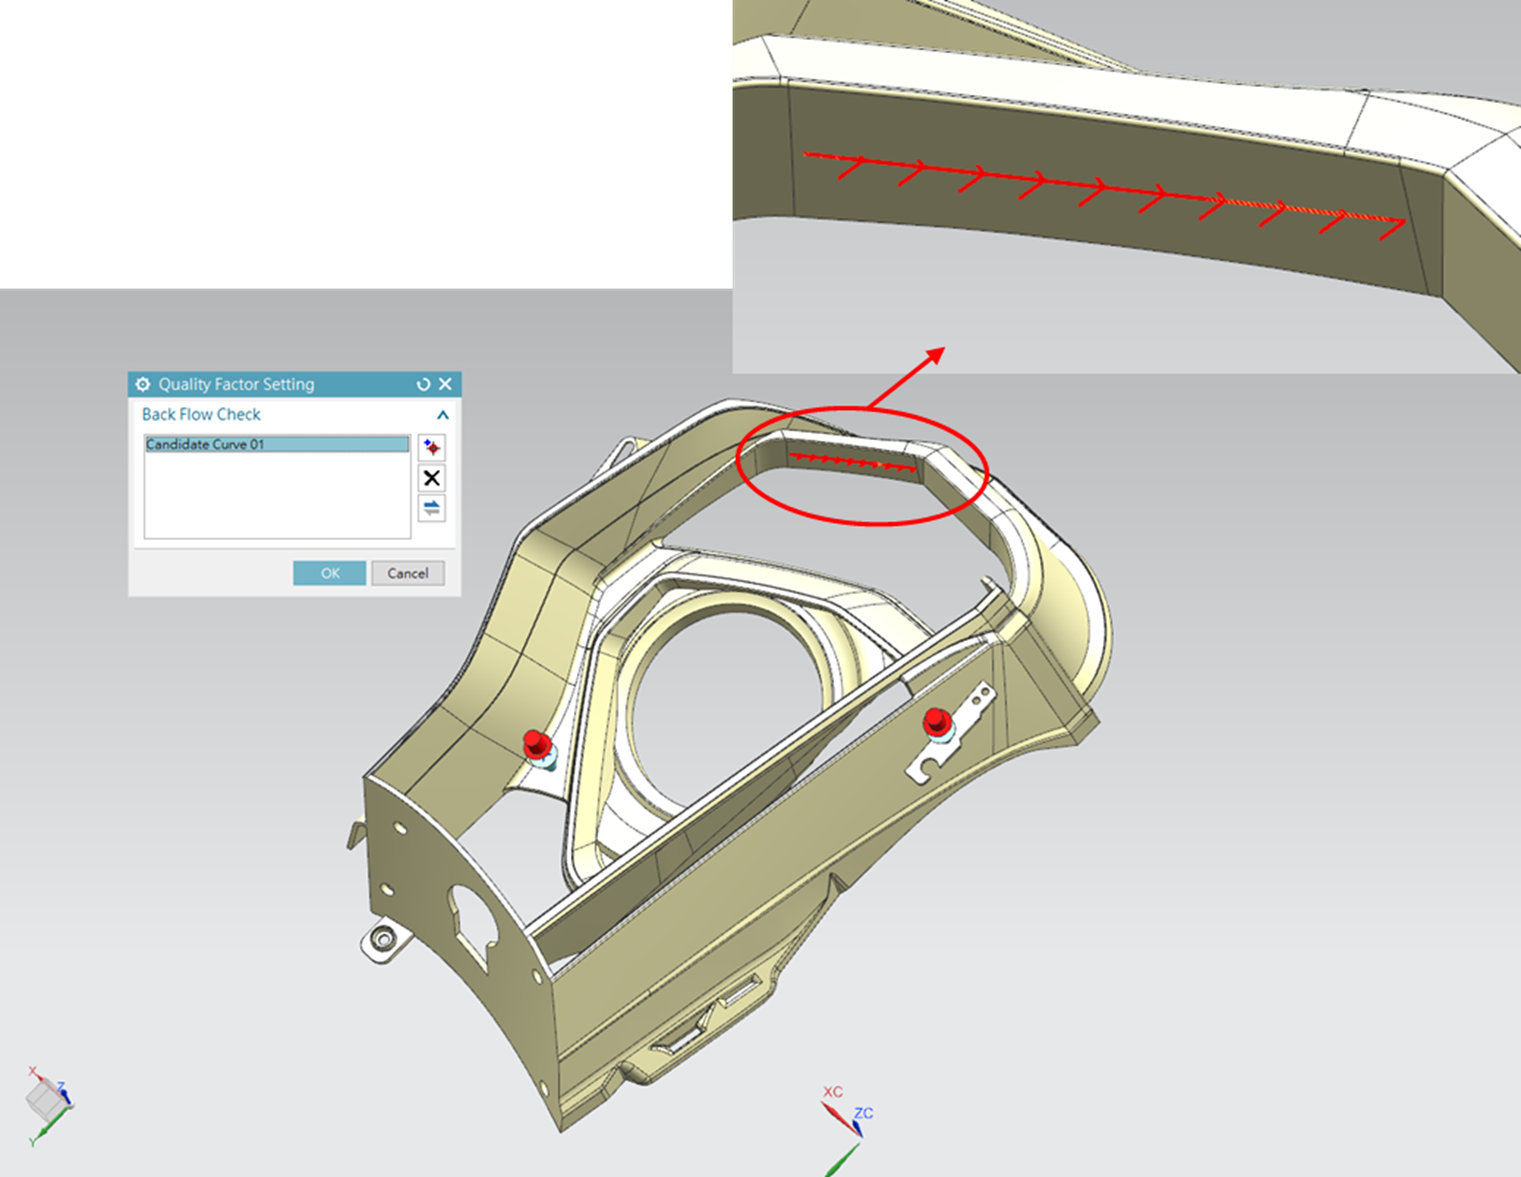
Fig. 4 The line segment position and direction of back flow
Actual Case Result Interpretation
In the optimization analysis results, we can see the relations between the control factors and quality factors in all the combinations through the parallel coordinates plot (Fig. 5). In the figure, there are several combinations with 100% backflow check results, so we can decide which one is the optimal combination through the quality response plot (Fig. 6). From the quality response plot, we can see that when the higher level of the control factor is, the higher value of the backflow check will be. Thus, Design 9 is the optimal one, as shown in Fig. 7.
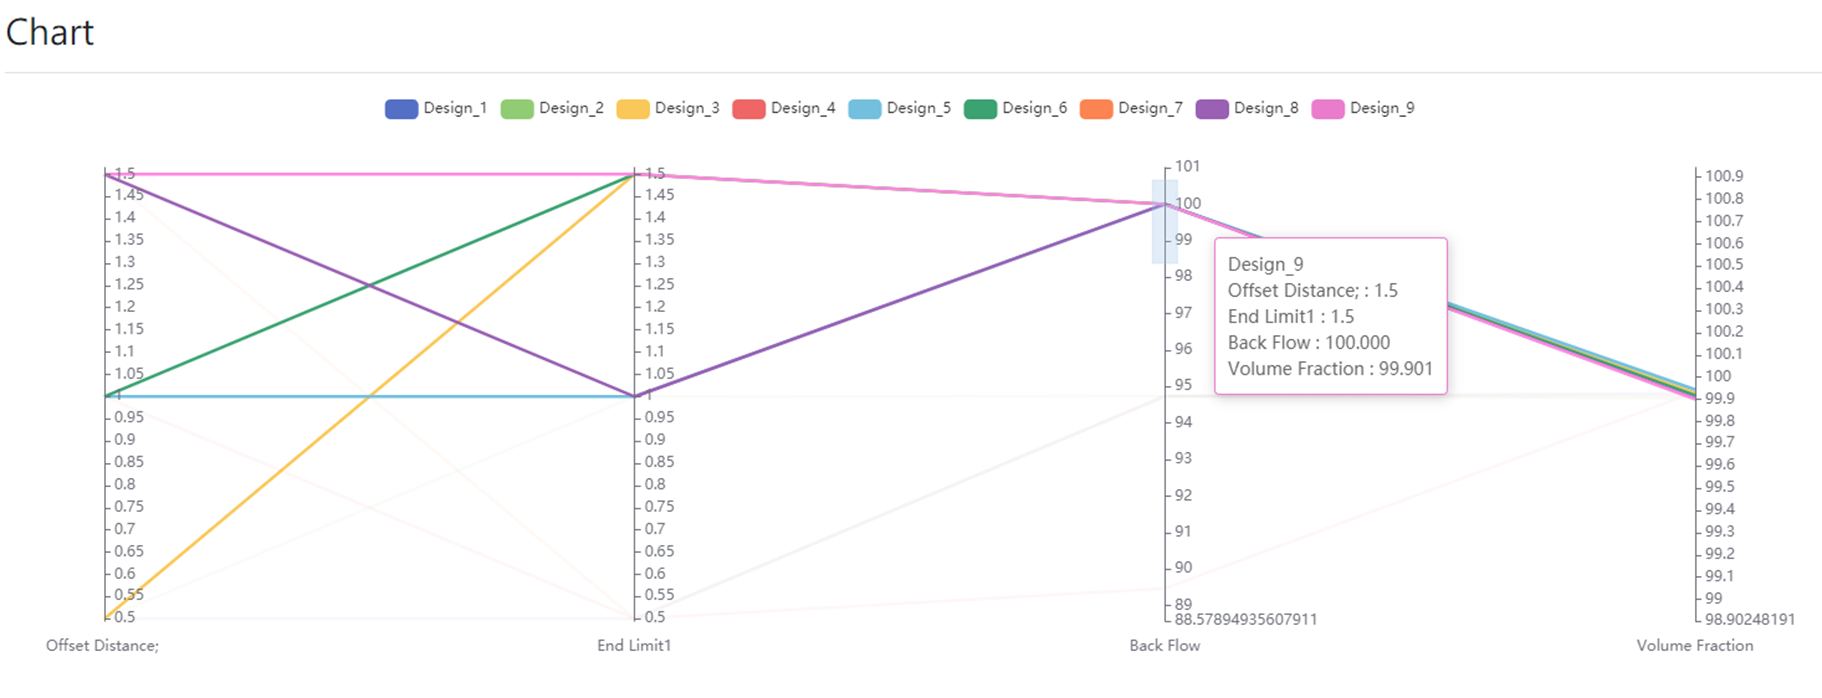
Fig. 5 The parallel coordinates plot
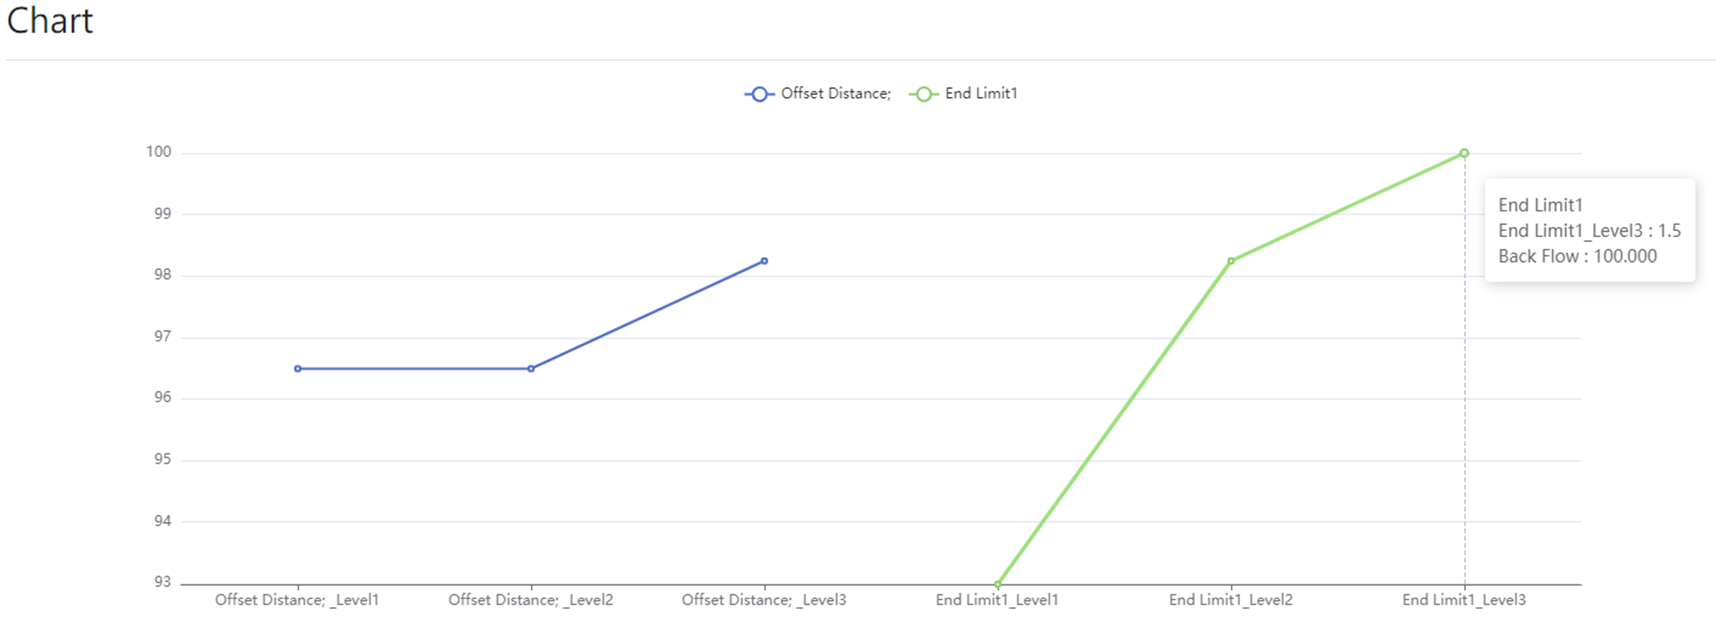
Fig. 6 The quality response plot
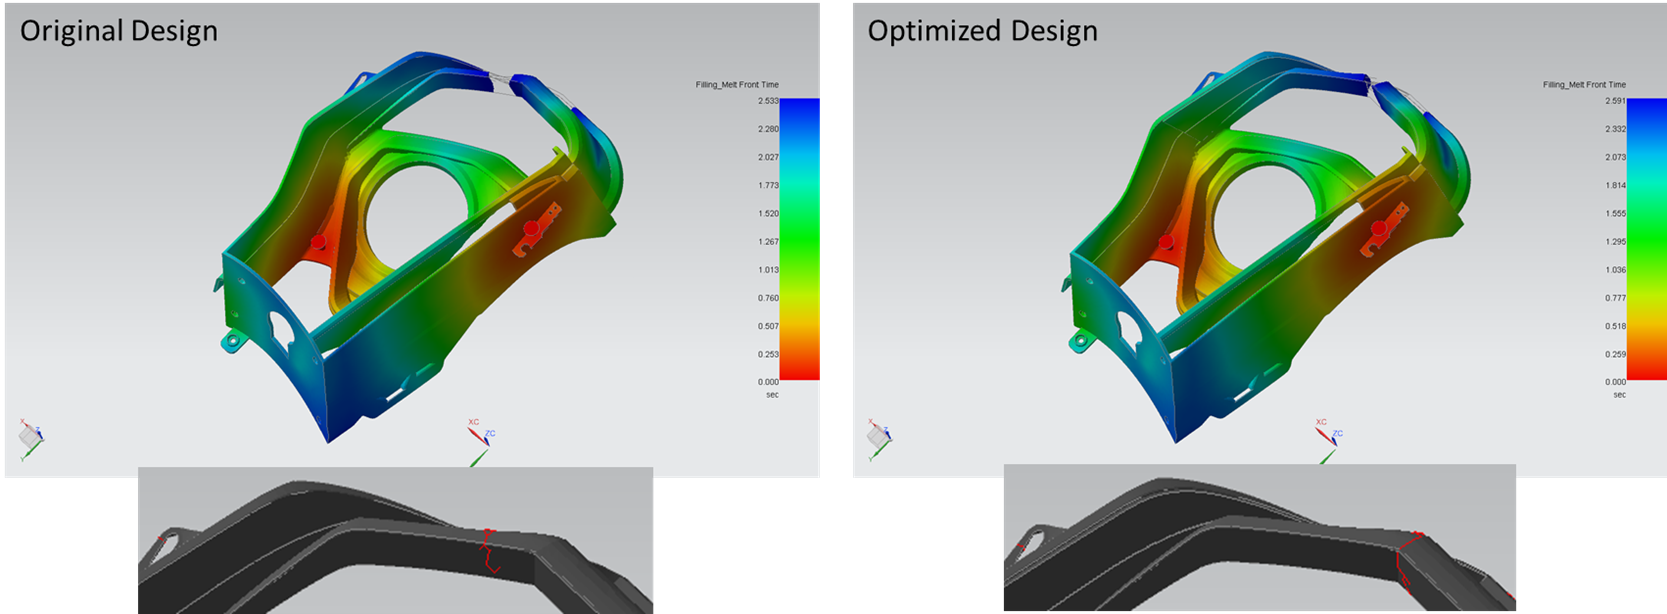
Fig. 7 The optimized combination in the real case
More About the Design Parameter Study (DPS)
Besides DPS being embedded in Moldex3D SYNC, more integration with other optimization software is ongoing. With the algorithms of other optimization software and the CAE automation workflow of SYNC, users can find the optimal product design parameters. In addition, Moldex3D SYNC is developing the gate position optimization feature, providing users with more optimization methods in the future.