Fred Yang, Deputy Technical Manager at Technical Support Division of CoreTech System (Moldex3D)
The stages of product development or seeking an improvement to process quality often involves extensive parametric testing to find the optimal process conditions for production. In a single project, there may be simultaneous testing of various parameters, such as different materials, mold temperatures, melt temperatures, and injection pressures, to assess their impact on the final molded part. The results of these tests are not easy to organize, and the complexity of such parameters increases the difficulty of subsequent data classification and organization, consuming a significant amount of time and effort.
The Project summary run grouping feature in Moldex3D addresses this issue by providing group folders for organizing and categorizing analyzed groups. This allows for easier organization of analysis groups. For result comparisons, users can utilize the Group Overview Excel format reporting feature to conduct chart comparisons for multiple groups. This visual comparison facilitates a clear understanding of the impact of different variable settings. It simplifies classification and organization of simulation results, offering a user-friendly interface for verifying parameter settings. This can reduce human errors in the testing process, thereby enhancing the efficiency of product development.
The following steps involve grouping configuration, output setting information, and comparing operational parameter results.
Step-by-Step: Finding the optimal molding conditions for mold temperature and melt temperature
The mold temperature and melt temperature significantly affect the plastic flow during injection molding, and typically material suppliers provide recommended material operating ranges.
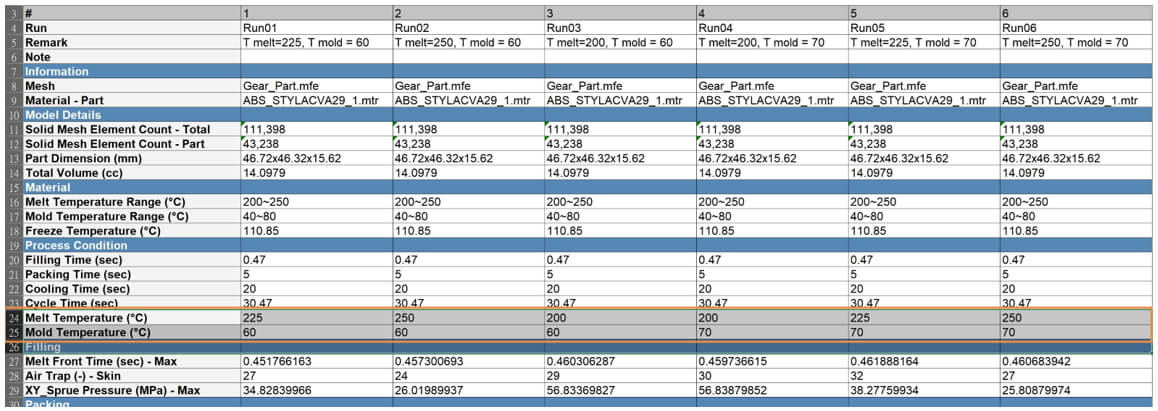
For example, the Material Wizard suggests material operating conditions (as shown in orange frame in Figure 1), with a mold temperature range of 40°C to 80°C and a melt temperature operating range of 200°C to 250°C (highlighted in the red frame in Figure 2). Following the recommended molding conditions, multiple sets of operating conditions can be configured for analysis. In the example, two mold temperature conditions (60°C and 70°C) and three melt temperature conditions (200°C, 225°C, and 250°C) are set for analysis. The differences in results are then analyzed and compared, allowing for a further assessment of the optimal mold temperature and melt temperature conditions.
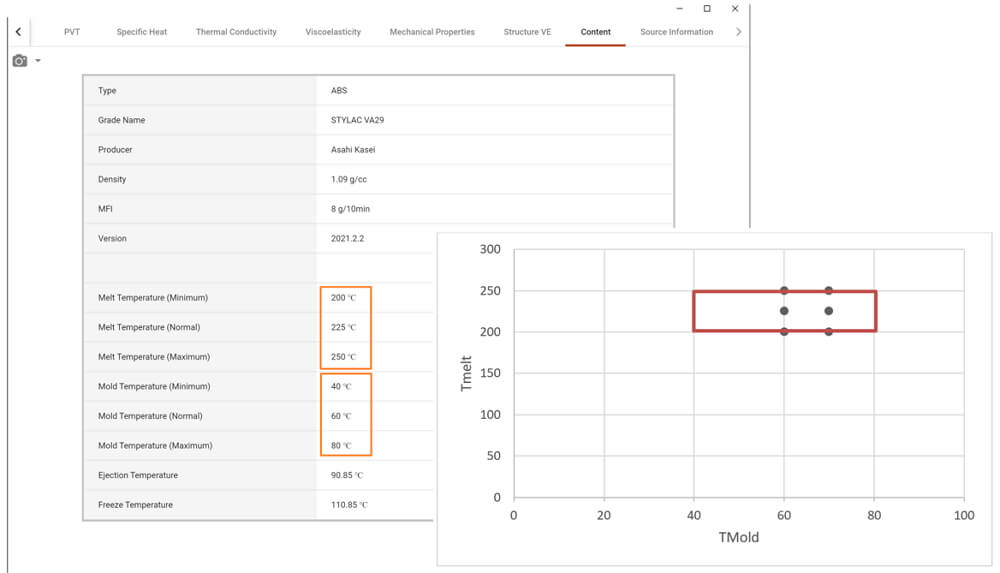
Figure 1. Suggested Material Operating Condition Setting
Step 1: As the example described, prepare a project in Studio with 6 runs for different Melt and Mold Temperature. Right-click on the project name and choose Run Summary.

Step 2: Click Update and confirm project information in Studio. Compare and analyze the results to find the optimal conditions. Choose ![]() icon, select the format, and export the Excel file.
icon, select the format, and export the Excel file.
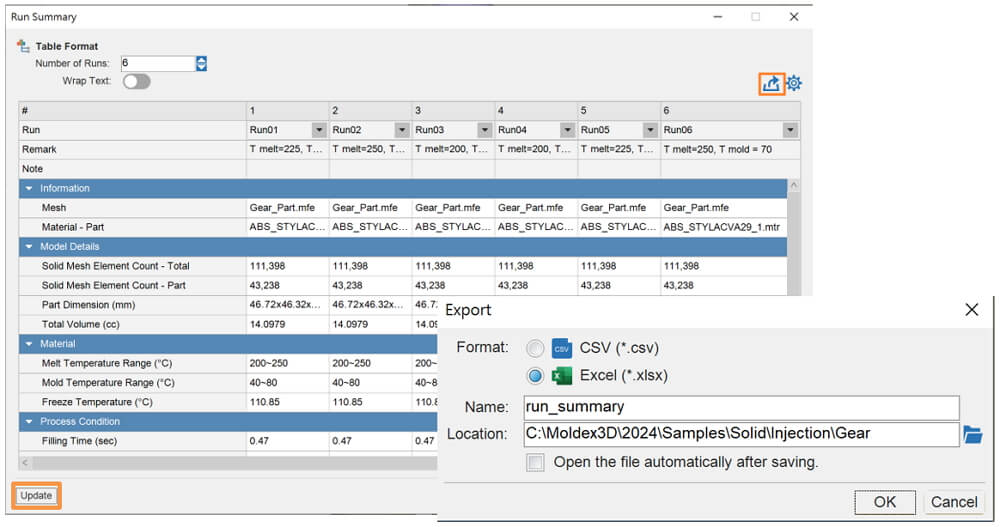
Step 3: View the Excel report for multi-group comparison, inspecting the parameter information for groups within the project. In this example, the maximum injection pressure is used for comparison to determine the best operating conditions. Groups 2 and 6 exhibit lower maximum injection pressures, making them optimal operating conditions.
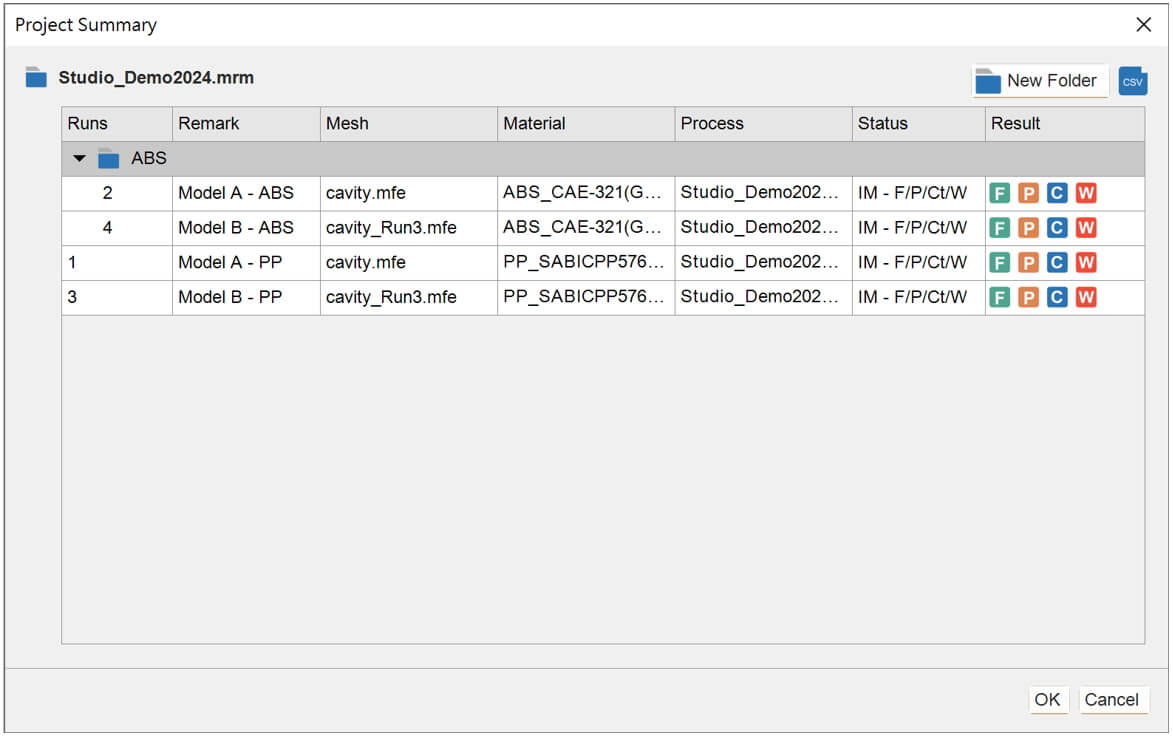
Note: The group folder functionality helps organize and categorize analyzed groups.
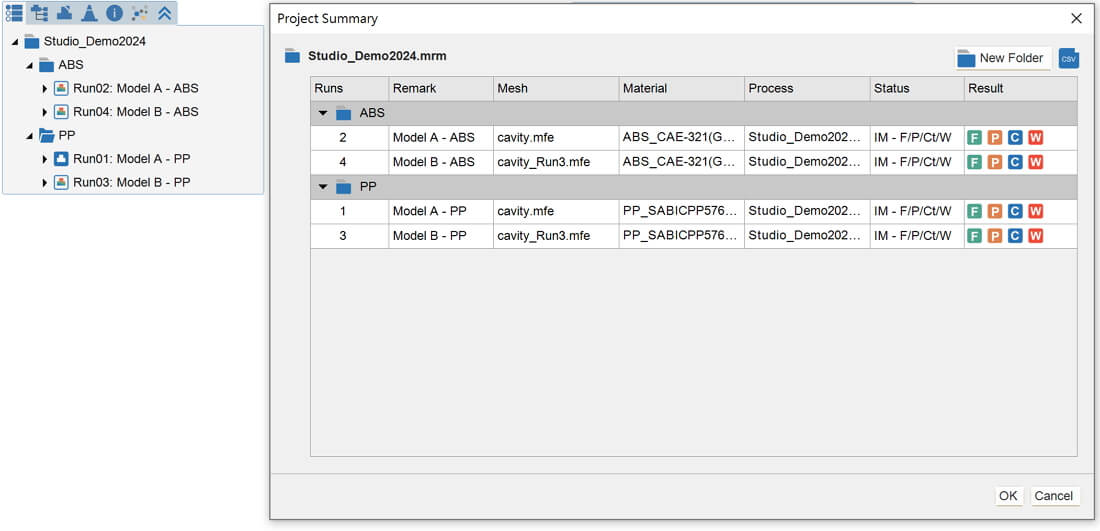
In the parameter testing process, users set different materials, mold temperatures, melt temperatures, and other relevant parameters based on testing requirements. These settings are analyzed and organized into groups. This grouping not only allows for displaying grouped information in the Project Summary but also applies to the Model Tree display.
For example, in a project comparing the differences in the impact of different mold temperatures on PP and ABS, users create groups for PP and ABS (as shown in Figure 2). Right-clicking on the group in the Model Tree and selecting the “Run Folder” function brings up the Project Summary page (as shown in Figure 3).