Combination of PU FOAMAT System with CAE Simulation for Accurate PU Foaming Prediction
 |
Joe Wang, Manager at Material Measurement Center of CoreTech System (Moldex3D) |
Polyurethane foam (PU foam) is a common thermoset material used in automotive manufacturing. It is a porous, low-density and high-strength material, and these features make polyurethane foam a popular material that popular in light weight and insulation applications. The most common applications include automotive steel wheels, seats, interiors and the parts under the hood, and electronic components. The desired end properties of the foam can be altered via the choice of specific components along with their required quantities and process condition, making them a versatile material of choice in light weight application in many different industries. Additionally, due to the thermoset nature of polymer, it can withstand higher temperature without melting.
Although polyurethane has the advantages mentioned above, there are some technical challenges in the processing of polyurethane foam. In reality, the location of the foam within the part is not easy to access. Often the part defects such as large voids due to incomplete filling and foaming can only be identified after the mold is made and part is produced. Other factors such as venting locations and conditions also have significant influence on the part quality. Furthermore, a large amount of wasted polyurethane materials generated at overflow during the foaming process need to be reduced or recycled.
CAE simulation is commonly used to detect the dynamic behaviors in the mold filling and foaming process of polyurethane foam (PU foam), and fine-tune process conditions and optimize the product designs. Moldex3D’s approaches are to combine the model development closely with experiments to better understand the foaming phenomenon, to parameterize and modify material model, and to validate the models once they are developed. The material models should be able to predict the filling, foaming expansion, curing, and final foam properties, all of which are still quite challenging. Adding to the existing simulation difficulties is deriving accurate PU reaction properties since the reaction is fast and the volume is constantly changing. The foam rise height, reaction temperature, rise pressure, curing and viscosity need to be measured in order to accurately reflect physical parameters during foam formation.
Polyurethane is a chemically blown foam, where the foaming agent CO2 is produced via chemical reaction between isocyanate and water. At the same time, isocyanate also reacts with polyol in a competing fashion that generates the polymer. A new kinetic model that decouples these two completing reactions is required. Even though our approach is based on the previous literature work, it is unique in that a new kinetic model, which follows a simplified mathematical formalism that decouples foaming and curing reactions. Furthermore, the approach is thoroughly grounded by experimental data, where isocyanate is always in excess and does not affect the reaction kinetics.
In this study, we employed FOAMAT (Fig. 1), a universal foam qualification system, to thoroughly study foaming characteristics of PU foam. The experimental data is then fitted with appropriate material model, generating modelling parameters. The material parameters are subsequently used in simulations, and using a specific container (advanced temperature container), the resulting experimental results (height and temperature) are compared with the simulations results. Currently PU simulation software is still very rare, with a huge market demand and potential customer base, particularly in automotive, aerospace, and sporting sector for light weighting applications.
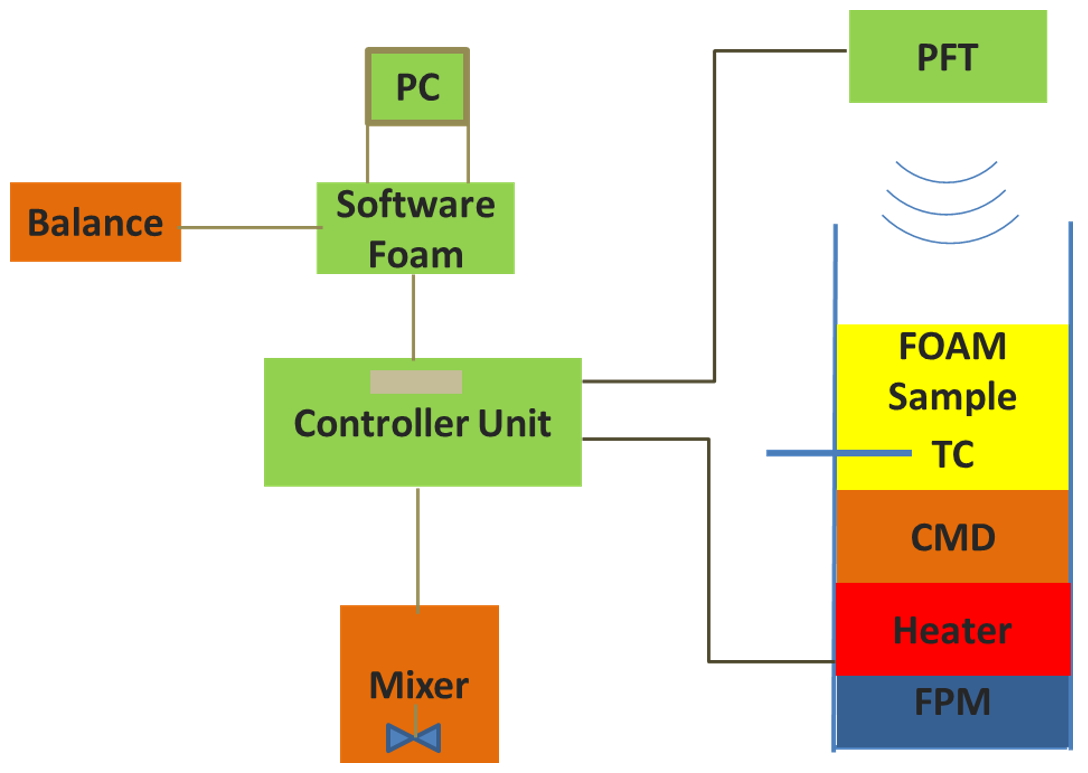
Fig. 1 Schematic of the foam qualification system FOAMAT
We have carried out experimental investigation on the physical parameters during foam formation using FOAMAT 285 and PU material with the code name BE. The PU raw material has the following specified characteristics at 23 °C: mixing ratio poly to isocyanate 100:63 w/w, water content 0.60 wt%, cream time 9s, rise time 32 and free rise density 172g/L. Given the cream time 9s, this PU material is extremely fast. The material starts to react and foam as soon as the two reagents are mixed, adding to measurement difficulty.
The reagents were mixed according to the specified amount using weighting balance, and the weight loss due to transfer from the container to the advanced temperature container (ATC) was carefully documented, so as to obtain the most accurate material parameters. The ATC provides controlled temperature environment so the effect of temperature on the reaction rate can be determined. The temperature dependence is crucial for simulation since during actual production elevated temperature is used. The experiments were conducted at 30, 40, 50 and 70ºC. We observed that due to consistent temperatures, the measurement results of ATC are much more reproducible than those measured in non-thermostated test containers.
Reaction temperature was also measured. The maximum core temperature was measured by placing the thermocouple in the lower third of the foam. The raise profile was recorded patented ultrasonic fan sensor, especially designed for measuring the distance to the foam bun with high accuracy. The dielectric polarization is a new measurement parameter that gives insight into the electrochemical processes occurring during foam formation. Dielectric polarization is essentially caused by chain-like molecules with a large dipole moment due to their polar ends (OH, NCO). Chain formation precedes the cross-linking reaction that ultimately suppresses all dipole mobility by curing. Hence, dielectric polarization value can reveal the degree of curing during course of reaction (Fig. 2). Viscosity was measured using a parallel plate rheometer MCR502. The sample was first treated with molecular sieve to remove water. The foaming material does not follow the Cox-Merz rule; therefore, we test its rheology using steady shear in parallel plate geometry. It has been shown that shear viscosity was independent of shear rate at 0.01 s-1 and below. Furthermore, it has been demonstrated varying the gap between the plates (0.5 mm to 2 mm) showed that there was a small effect on the measured viscosity compared to the change in viscosity over time, an hence we did not attempt to correct the data for slip. Measurements were taken (at 0.01 s-1 and with a gap of 1 mm) at five temperatures from 30~ 50 °C in increments of 10°C.
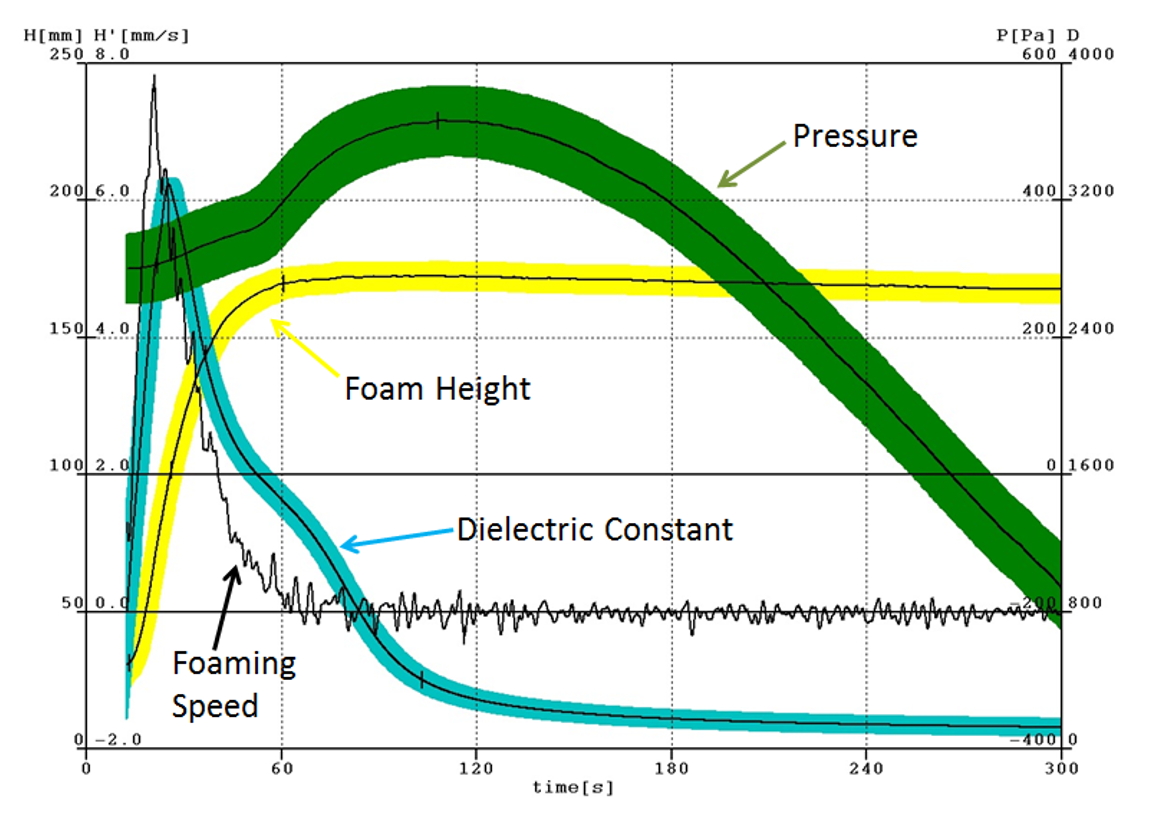
Fig. 2 Typical experimental data of ELASTOFOAM CI 4510/136/LD series for rise height, rise rate, rise pressure, and dielectric polarization are recorded simultaneously and are displayed in a graph.
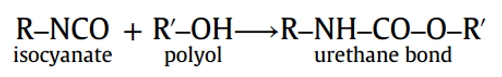
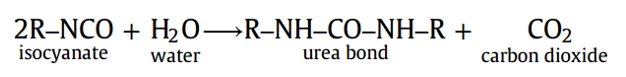
The following chemical reaction occurs when mixing the raw materials (isocyanate, polyol, and water):
Gelation reaction: The chemical reaction between isocyanate and polyol produce urethane bond. The polymerization reaction of urethane bond proceeds to produce the polyurethane polymer
Blowing reaction: In the same time, the chemical reaction between Isocyanate and water produce carbon dioxide gas
Here, we used two separate rate equations to describe the competing foaming and crosslinking reaction rates.
In order to obtain temperature influence on the foaming properties, the experiments were conducted at several different temperatures. The foaming height and the dielectric constant results are shown in Fig. 3 and 4, as well as pictures of the actual samples from the measurements are shown in Fig. 5. In all cases, there is a strong temperature dependence on the foaming properties on the temperature. The foaming height is proportional to the temperature. The density of the rising foam at any time is obtained from the expansion ratio and foaming conversion of PU foam.
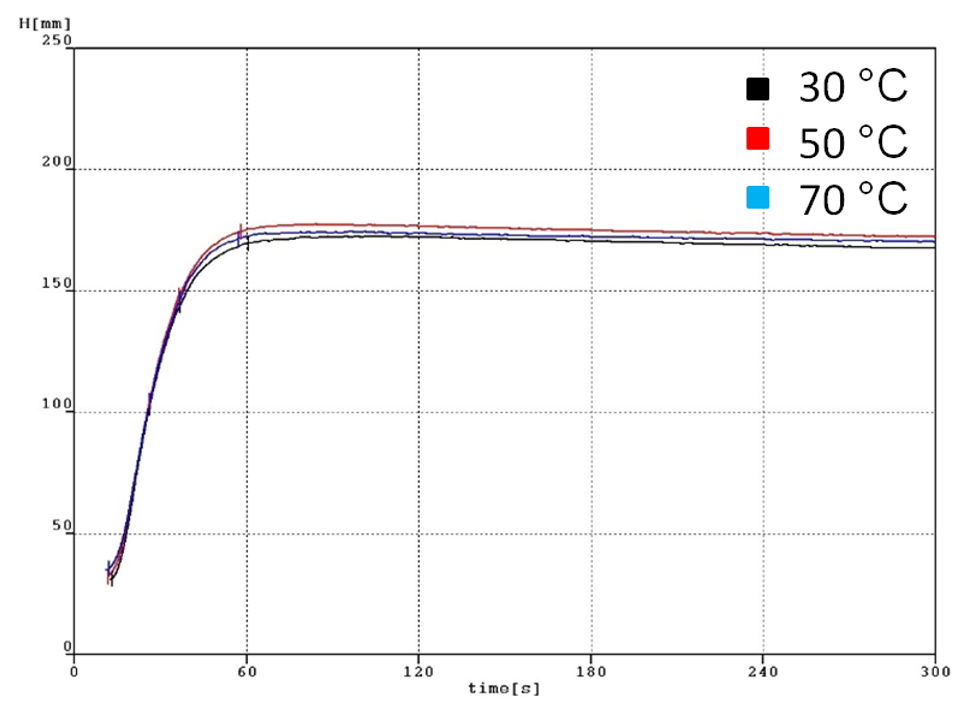
Fig. 3 Foaming heights at different temperatures
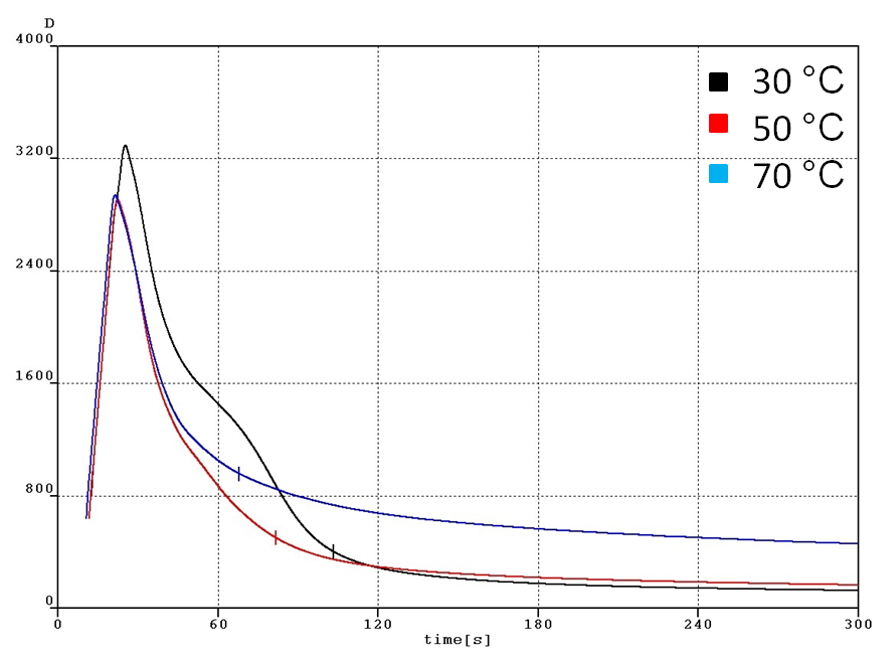
Fig. 4 Dielectric constants at different temperatures
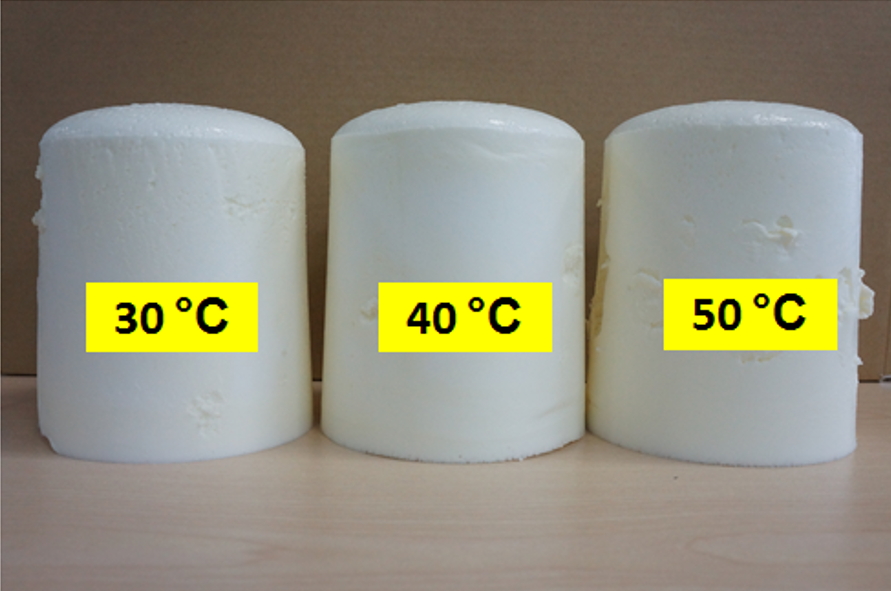
Fig. 5 Pictures of foaming experiments conducted at different temperatures.
Polyurethane foaming and curing has been studied by a number of researchers. The importance of having separate rate equations describing these two competing reactions is highlighted in Fig. 6. It is clear from Figure 6 that foaming reaction has a faster reaction rate that the curing reaction. The results are certainly consistent with the results reported by Sandia national laboratory. In general, the foaming reaction is designed to have a faster reaction rate than the curing reaction for the obvious reason that if the curing reaction is too fast, then the viscosity is too high for bubble formation.
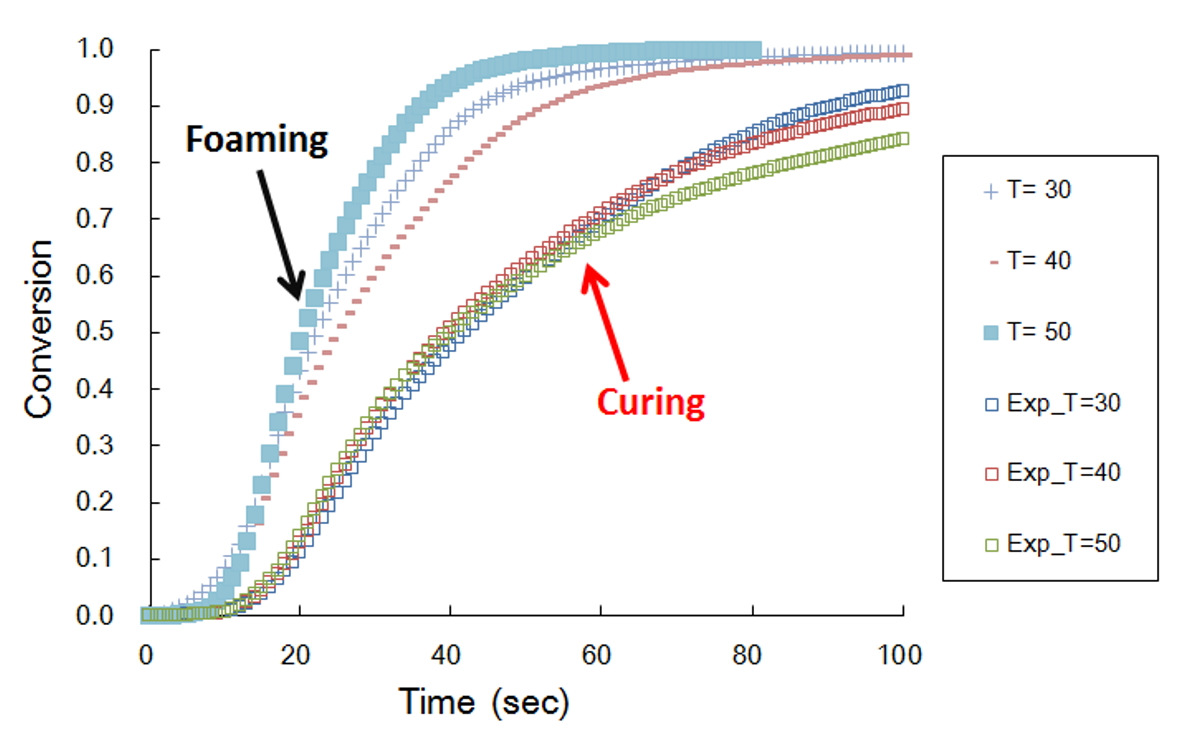
Fig. 6 Comparison of foaming kinetics and curing kinetics.
Fig. 7-9 shows the experimental validation of the foam height and temperature of polyurethane foam in ATC. The mold temperature and melt temperature is set at 30 oC. Figure 7 shows the comparison between numerical and experimental results of the final foam height in ATC. Figure 8 shows the history curve of the foam height from simulation, and experimental results of the final foam height as a comparison. In both cases the simulation results fits the experiments. Fig. 9 shows the comparison of the experimental and numerical results for temperature history curve. Since PU reactions are exothermic reactions, the system temperature increases with time. The temperature simulation results are close to the experimental ones.
Lastly, we input the measured PU material parameters into Moldex3D simulation module, optimizing the related design and process parameters, such as heating rods design, mold temperature setting, PU injection volume, venting design and setting, and so on.
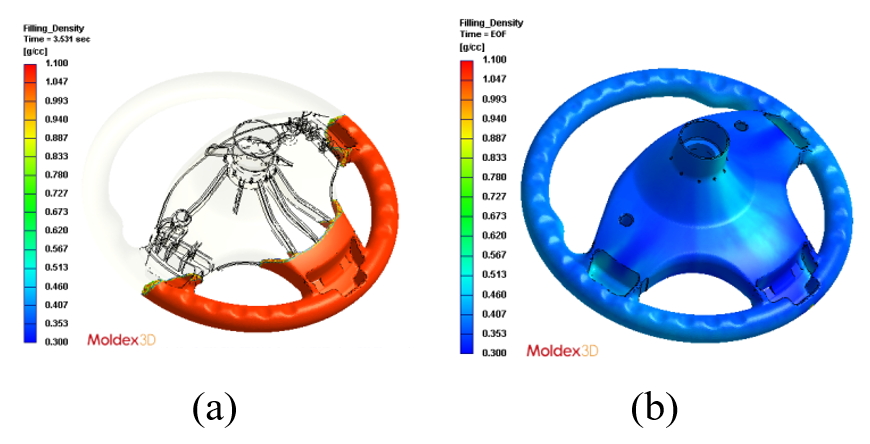
The part of interesting is a steering wheel part. The part volume is about 933 cc. In the process conditions, the partial fill volume percentage is 35% in 3.5 second. The mold temperature is 50°C, inlet stream at 25°C.
Fig. 10 shows the melt front of foamed polyurethane. First, the polyurethane melt will begin filling along the bottom of the cavity because of gravity. When the filling reaches at 35% of the cavity, CO2 gas will be released by the polyurethane reaction, and the polymer viscosity will increase due to the gelation reaction. Meanwhile, the reaction heat of the exothermic reaction will be released to increase the temperature of the cavity. As a result, more and more CO2 gases are released to the polymer melt under a relatively high temperature condition. Eventually, polyurethane foam will completely fill the cavity.
Fig. 11 shows the density distribution of foamed polyurethane. Density distribution reveals the expansion effect during foaming process. When the foaming conversion is higher, the more CO2 gas is produced. It causes the larger volume of polyurethane foam, and the lighter density.
Conclusions
In this paper, we carried out experimental investigations into PU material properties that are required for an accurate PU simulation. We used FOAMAT 285, a universal foam qualification system to measure physical parameters during foam formation such as foam rise height, reaction temperature, rise pressure, curing and viscosity. The measured foam physical parameters are then fitted using suitable material models, and used in PU chemical foaming simulation to optimal process conditions during foam formation. Lastly, with Moldex3D’s new simulation feature of polyurethane foaming, we can fully understand the dynamic behavior of the foam polyurethane material in both filling and foaming stage. More importantly, the in-depth analysis of polyurethane foaming enables users to avoid trial-and-error which subsequently leads to substantial time and production cost reductions.
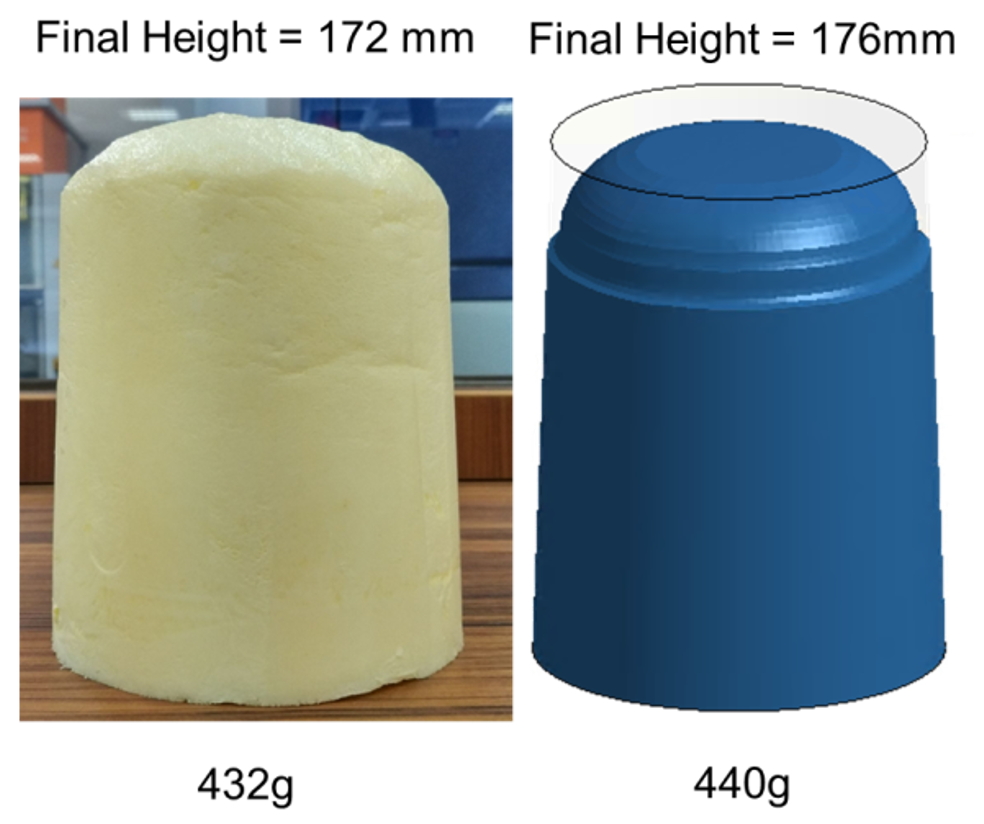
Fig. 7 Comparison of the experimental (left) and numerical (right) results of the final foam height in the ATC.
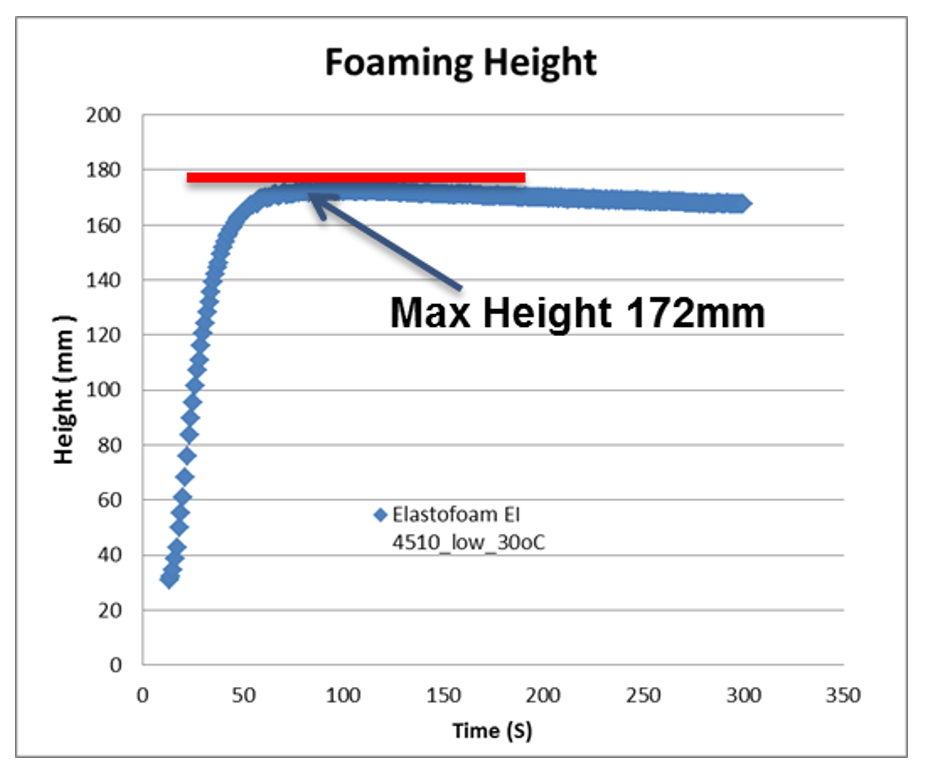
Fig. 8 Comparison of simulated foam height as a function of time and maximal foam height in experiments.
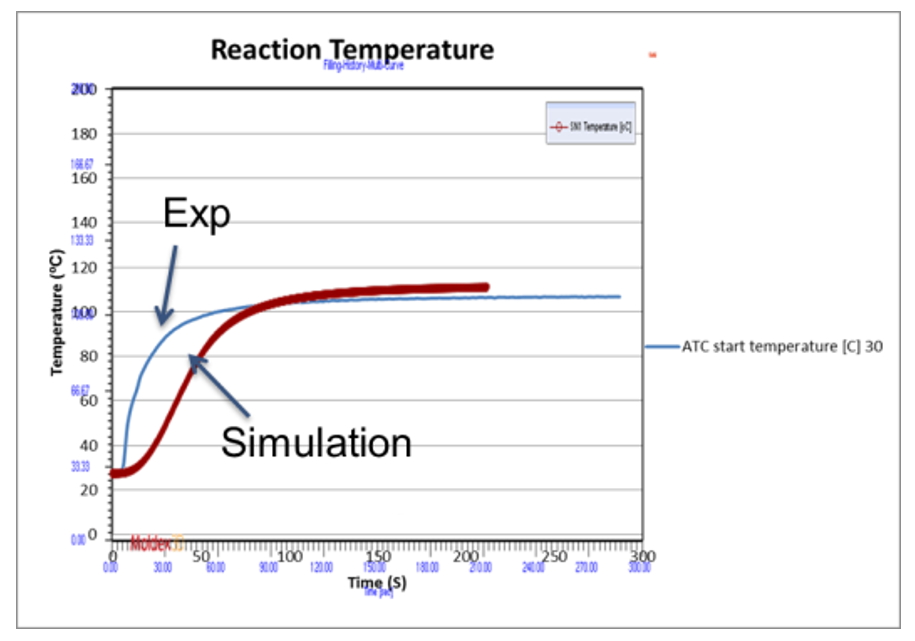
Fig. 9 Comparison of the experimental (blue line) and numerical (red line) results for temperature as a function of time.
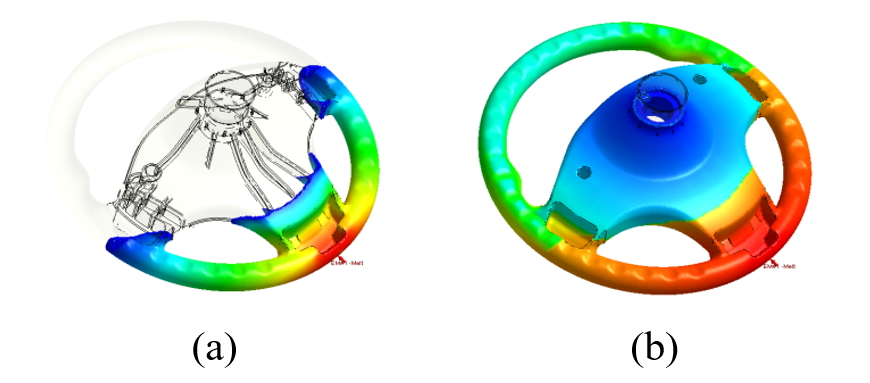
Fig. 10 Melt front at (a) 35% partial filled and (b) at end of foaming.