When producing injection-molded products, one often can only observe the final product and cannot directly witness the situations during the molding process. Understanding the state changes experienced by the molten plastic can be beneficial in comprehending potential issues that may arise in the injection molding process. In Moldex3D Studio, users can gain in-depth insights into the changes in plastic during the molding process through the history curves of Sensor Nodes. This data not only facilitates a deeper understanding of molding issues but also enables the optimization and improvement of molding conditions using PVT curves. This article will guide users on how to plot PVT curves in Moldex3D.
PVT Curve
Moldex3D Studio offers the Sensor Node function, which can be placed in various locations to read data and plot local history curves within the cycle time. For reading data on PVT-related curves, sensor nodes need to be pre-embedded (before Final Check), and their configuration must be completed before the analysis. The solver then will record the data value at these nodes throughout the entire analysis process, allowing users to observe and analyze the information. This approach differs from Probe Node, which rely on time output settings.
Step-by-step
Step.1: Prepare a project in Studio with model components and mesh.
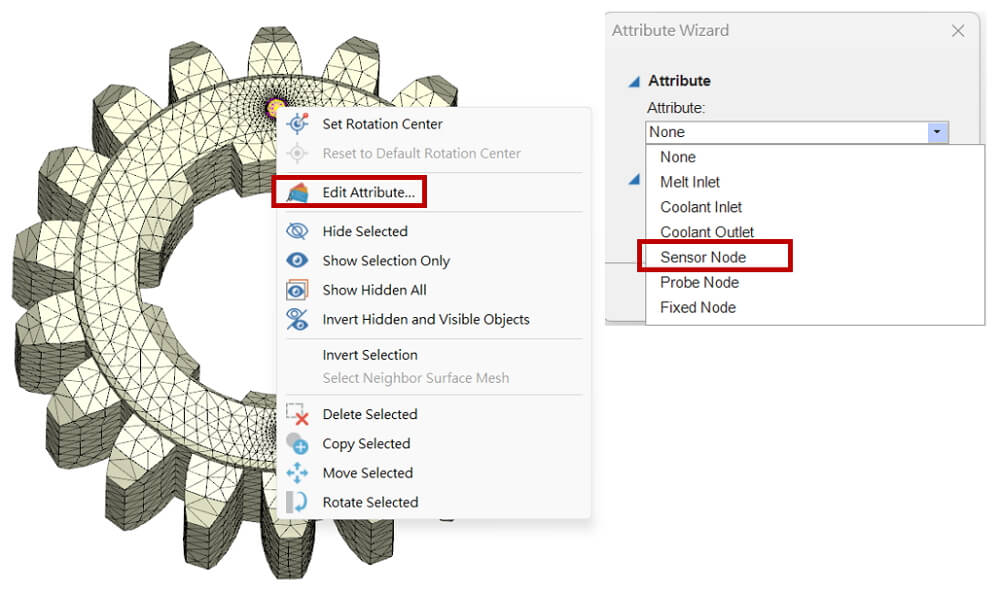
Step.2: Set points at the locations where the PVT information needs to be gathered and set its attribute as Sensor Node.
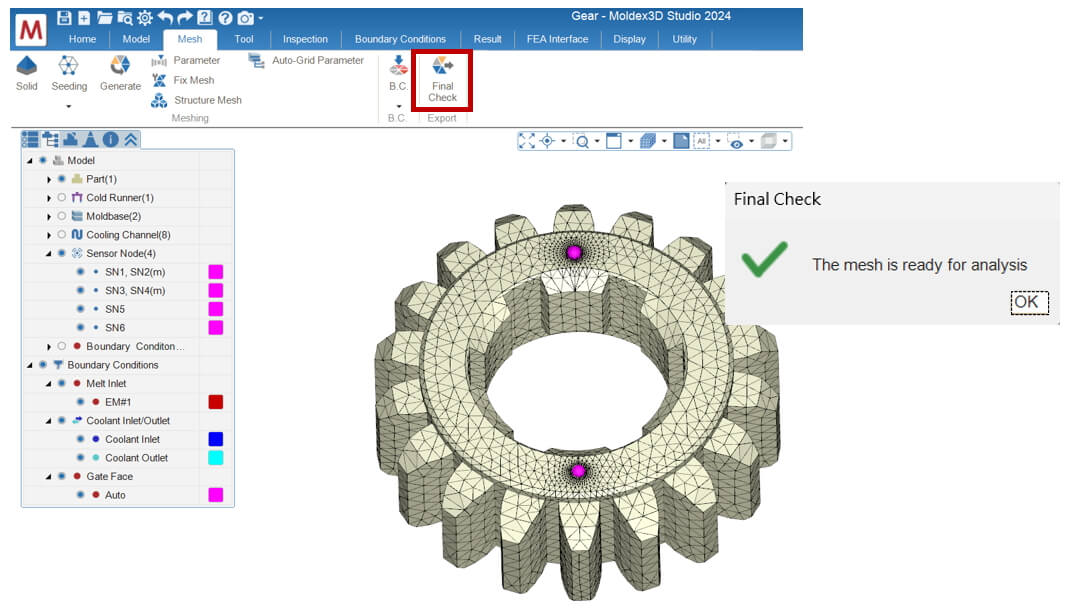
Step.3: After all model preparation and Sensor Node setting done, click Final Check to ensure the model is ready for analysis to finish preprocessing process.
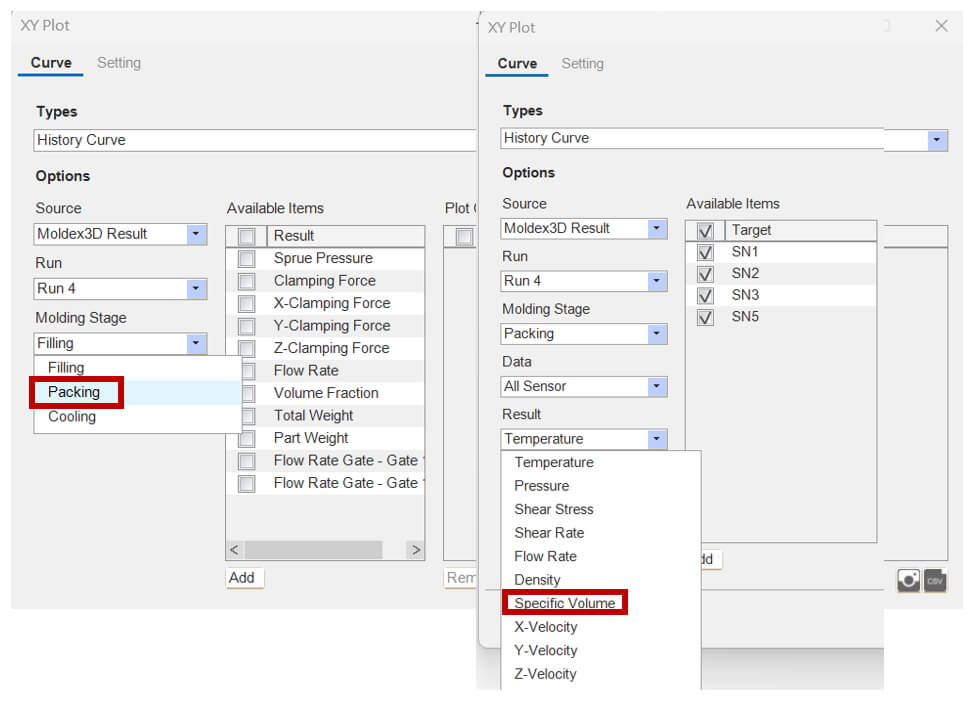
Step.4: Click on the History ![]() in the Result tab, choose the desired analysis group and molding stage in the pop-up wizard. Next, open the dropdown menu for data fields, select the holding pressure for the molding stage, and choose specific volume in the result items.
in the Result tab, choose the desired analysis group and molding stage in the pop-up wizard. Next, open the dropdown menu for data fields, select the holding pressure for the molding stage, and choose specific volume in the result items.
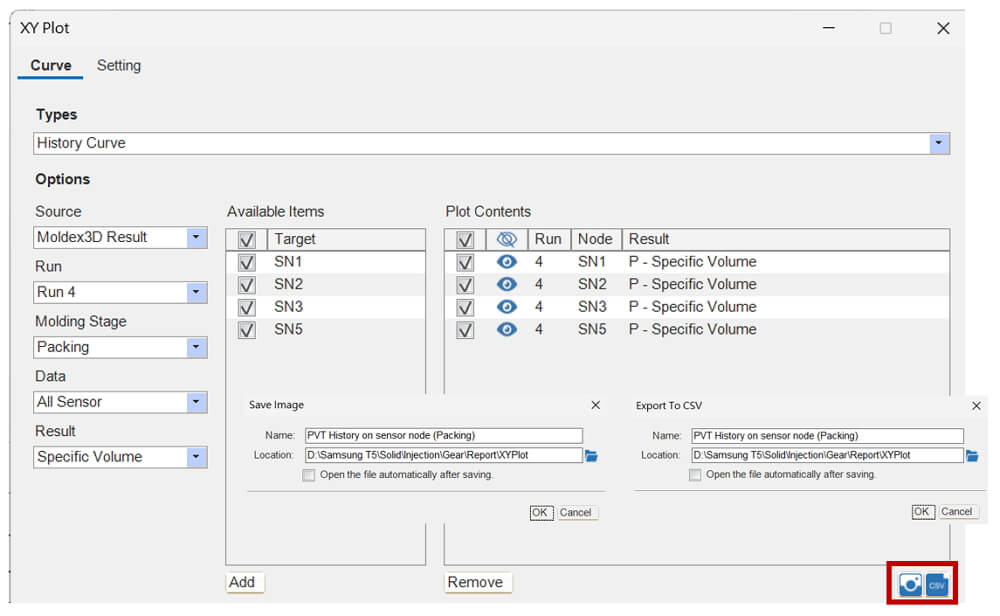
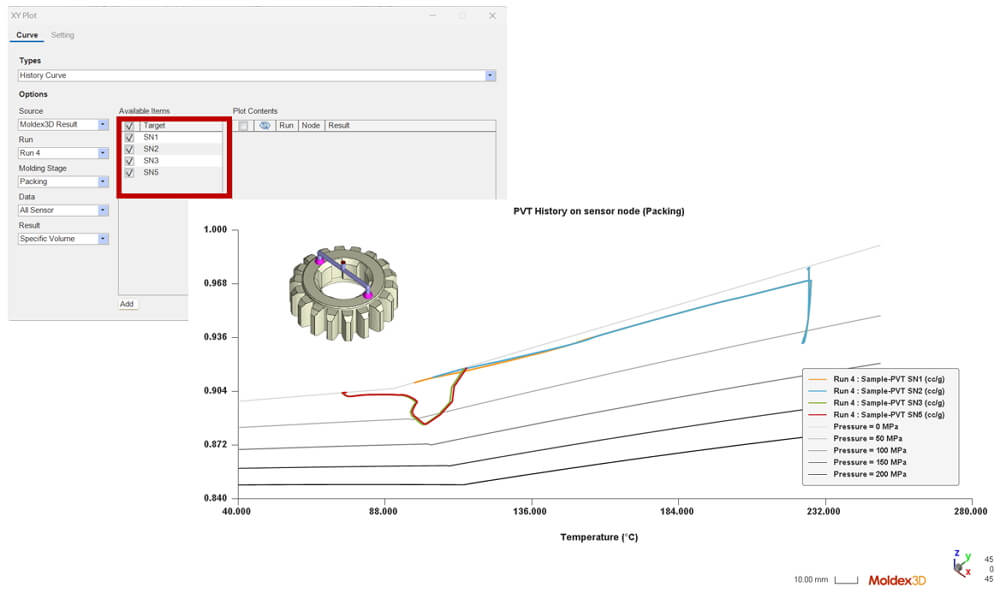
Step.5: Select the Sensor Nodes for property variation observation; click Add to plot the corresponding PVT trajectory curves. The resulting curve displays the variation of Specific volume (v) versus Temperature (T) during molding, with Iso-pressure (P) curves in an XY Plot.
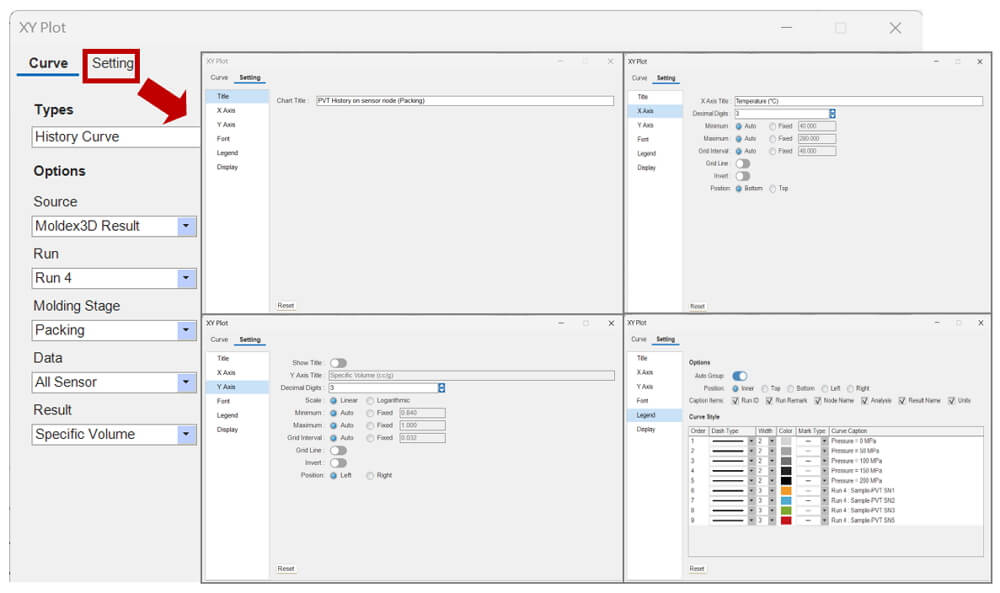
Note – Curve Legend Configuration and Output
Click on Settings to change chart titles, X-axis/Y-axis labels, legends, and other settings on different tabs. In the XY Plot Wizard, check the desired curves, then click ![]() /
/ ![]() Output to draw the picture/data.
Output to draw the picture/data.