
It is well known that the long fibers tend to break during injection molding processes. It is important to prevent excessive fiber breakage by changing gate locations or processing conditions. In Moldex3D R12 Fiber module, there are two newly added options for viewing the results: Average Fiber Length by Number and by Weight, which can help users predict whether the fiber breakage is reduced after design modification.
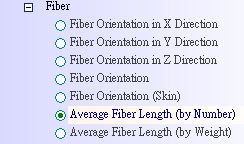
Since the fiber length distribution is a statistical result, both the number-averaged and the weight-averaged lengths are provided. If the number of longer/ heavier fibers is greater than the one of the broken short fibers in the part, the weight-averaged fiber length is much higher than the number-averaged fiber length.
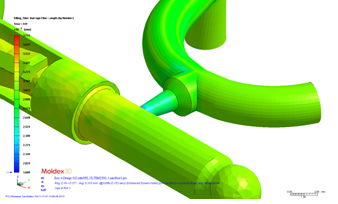
The fiber length shows little length variation by simply checking the surface
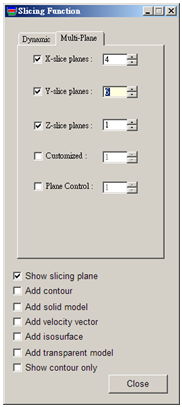
We can do cross sections to better observe the length distribution inside the part
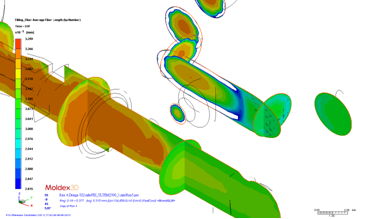
It is clearly seen that the fiber length near the gate is the longest since it travels the shortest distance after entering the cavity which reduces the chance of its breakage. On the contrary, the fiber is shorter at the end of filling.
The fiber length distribution has significant influence over the mechanical properties of fiber-reinforced plastics, especially for long fibers. It’s therefore very helpful to understand the fiber length distribution of the product parts.